|
Hawaii earthquake (2018 May 5 M6.9) & Eruptions 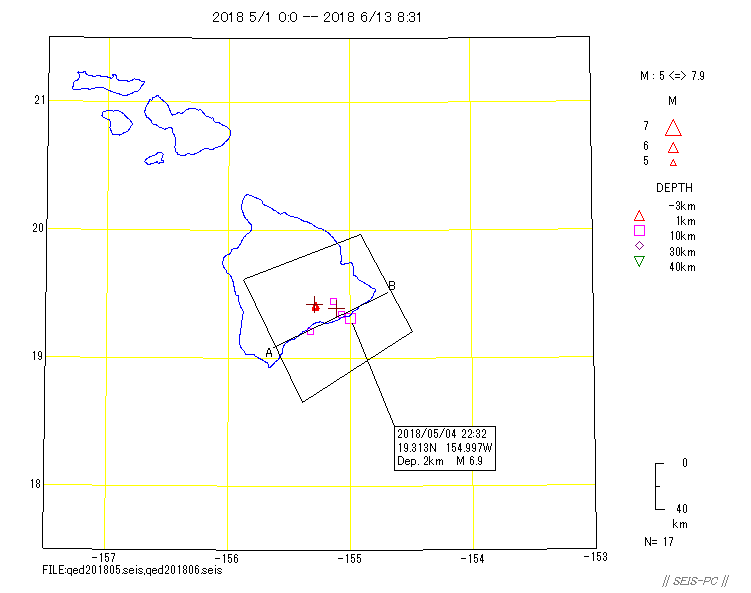 Fig.1: USGS earthquake data from 2018 May 1 to June 13 8:31 (UT). M>=5 and depth -3 to 40km. The left + is the location of Kilauea volcano and the right one is PuuO'o. 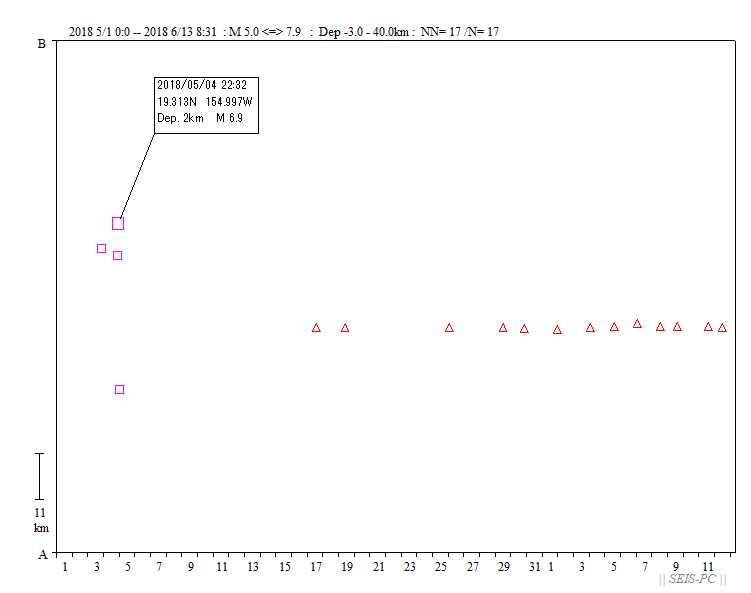 Fig.2: The time-space distribution of the hypocenters in the cut-out area in the fig.1. 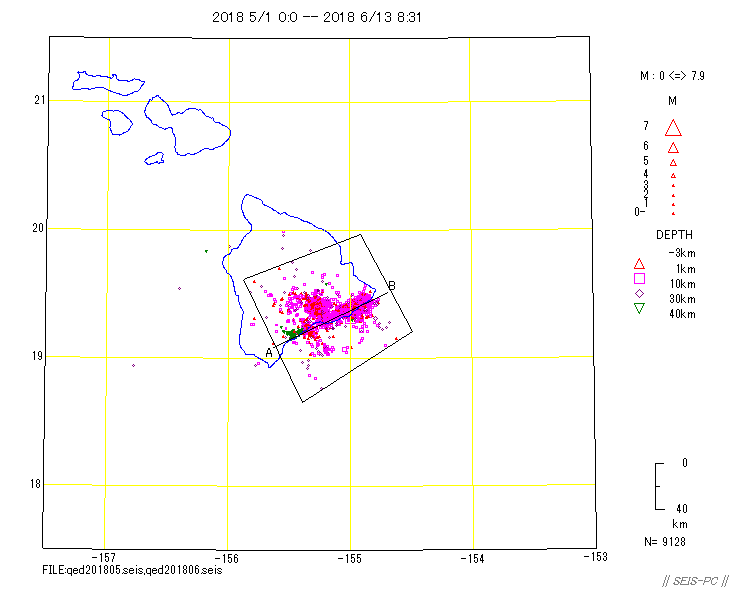 Fig.3: USGS earthquake data from 2018 May 1 to June 13 8:31(UT). M>=1 and the depth from -3 to 40km. 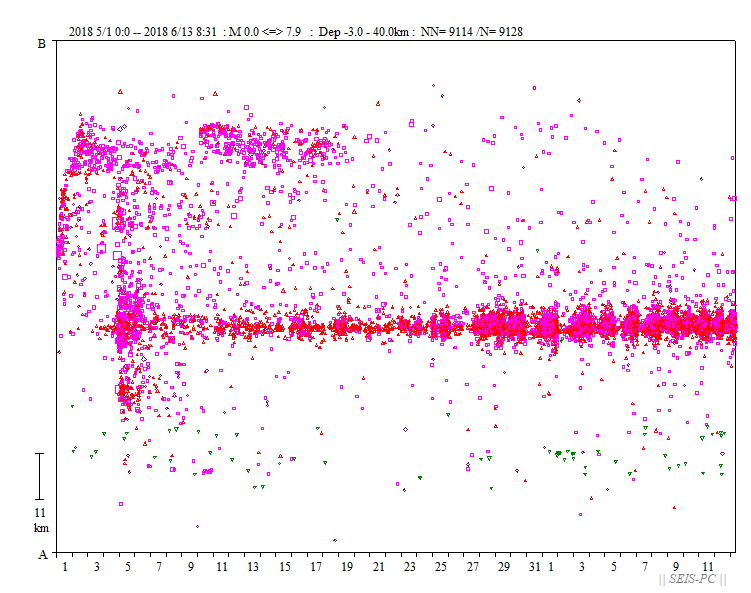 Fig.4: The time-space distribution of the hypocenters in the cutout area in the fig.3. The pattern of the seismicity was changed from May 27. 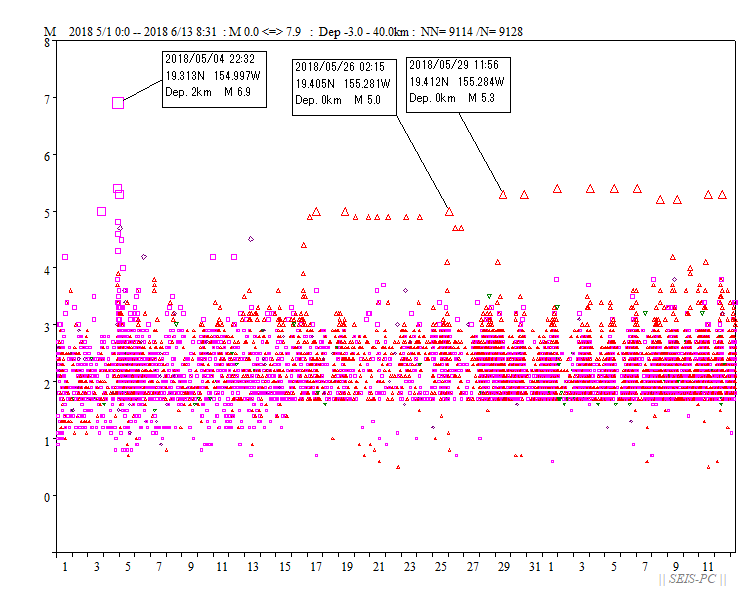 Fig.5: M-T figure. The small earthquakes were increased before M5 event(eruption). Just after M5, the number of earthquakes drop. 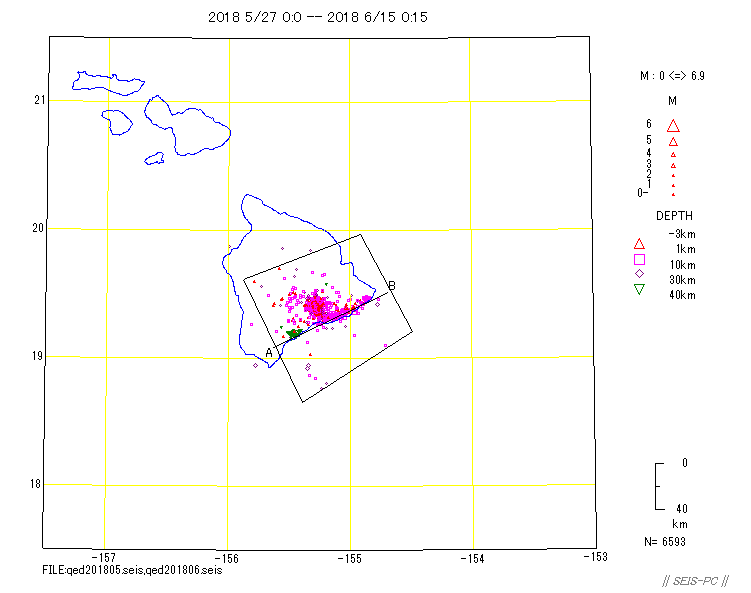 Fig.6: USGS earthquake data from 2018 May 27 to June 13 12:45(UT). M>=1 and the depth from -3 to 40. 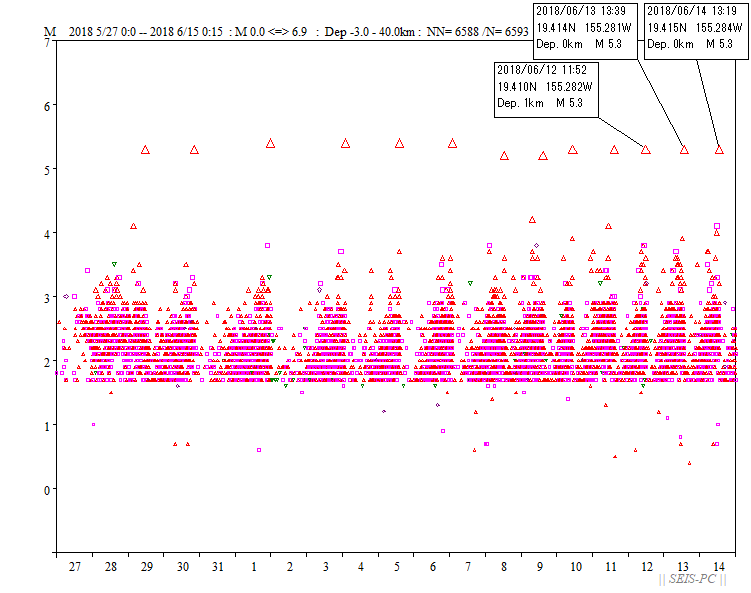 Fig.7: M-T figure of earthquakes in the cut-out area in the fig.6. This figure shows that the next eruption will be soon on 13th. 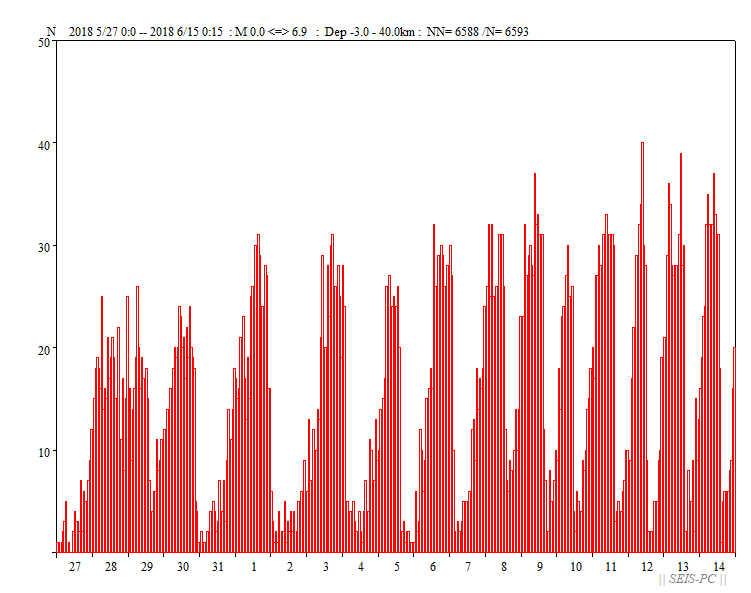 Fig.8; Hourly change of the number of earthquakes in the cut-out area in Fig.6. 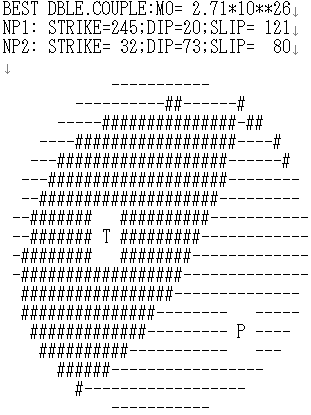 Fig.9: CMT solution by GCMT groupe. RUTUEN |