|
north off Mindanao (2017/02/10) M6.5 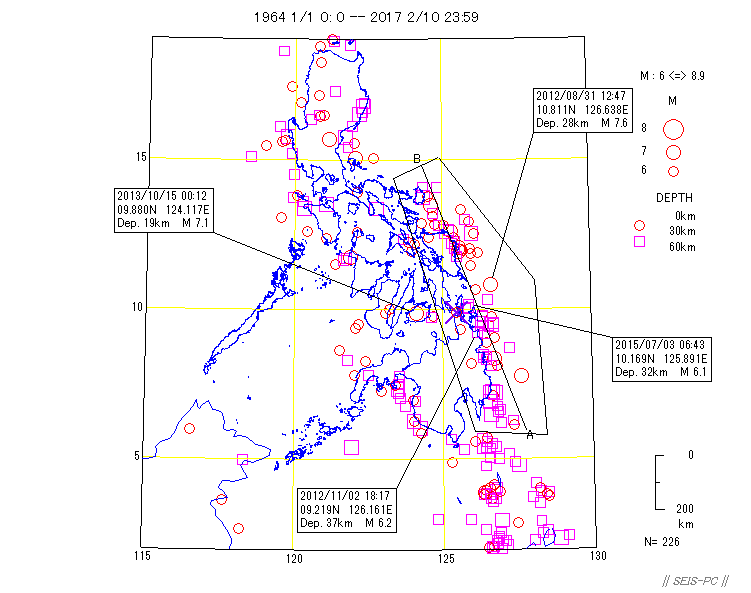 Fig.1 : Hypocenter distribution M=>6, Dep<=60km from USGS (UT). x shows the epicenter. 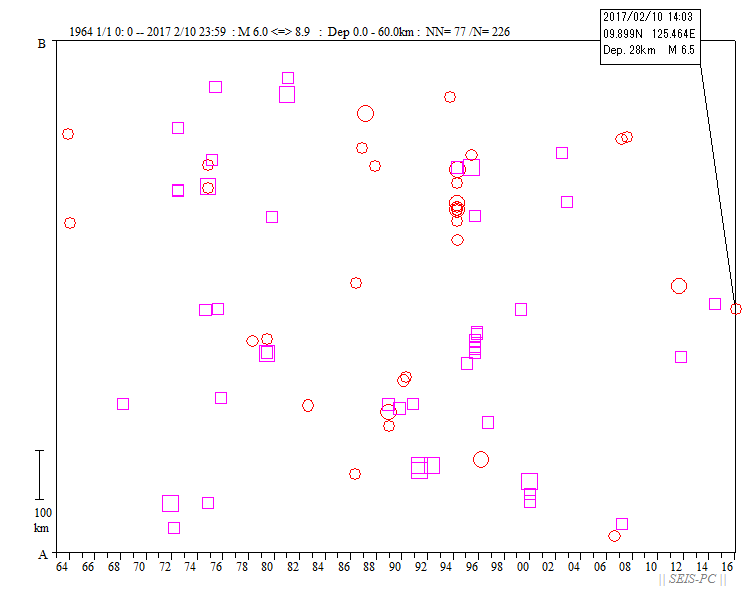 Fig.2 : Time-space distribution of the area cut down in fig.1. In these years, some earthquakes occurred near this event. 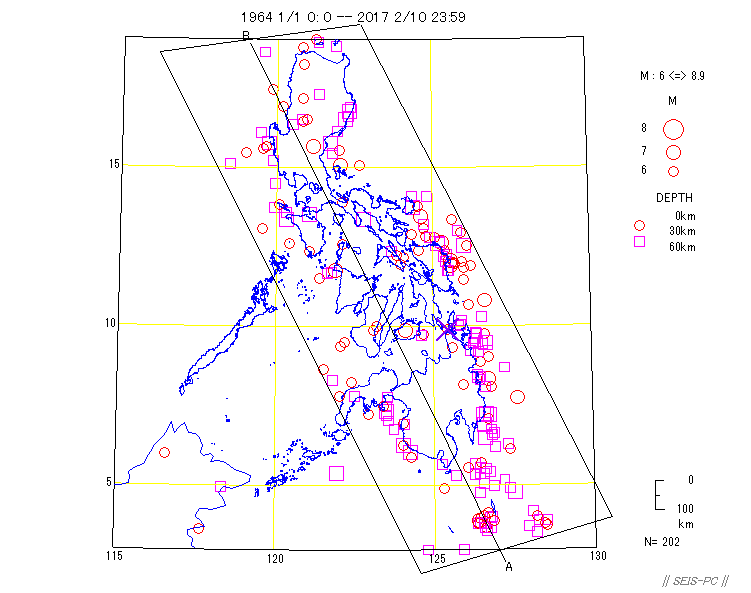 Fig.3 : hypocenters are the same as fig.1. 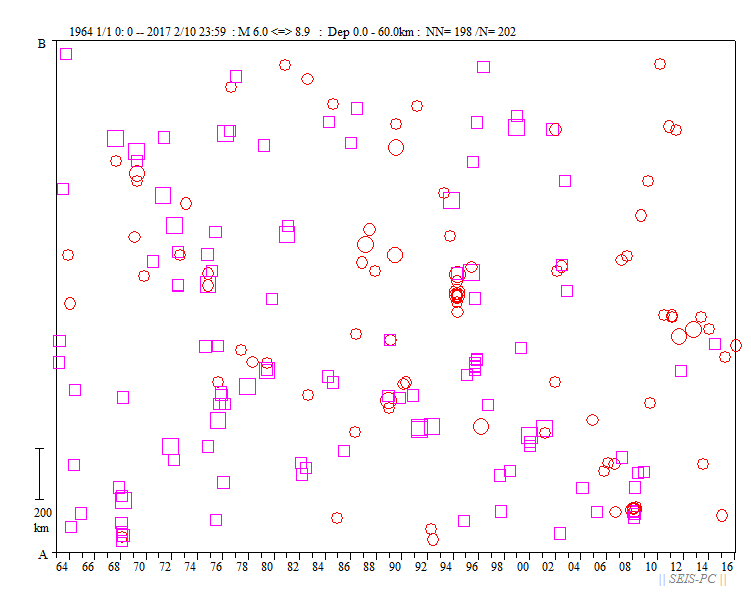 Fig.4 : Time-space distribution of the area cut down in fig.3. After 2011, many earthquakes occurred around latitude 10 degree N. 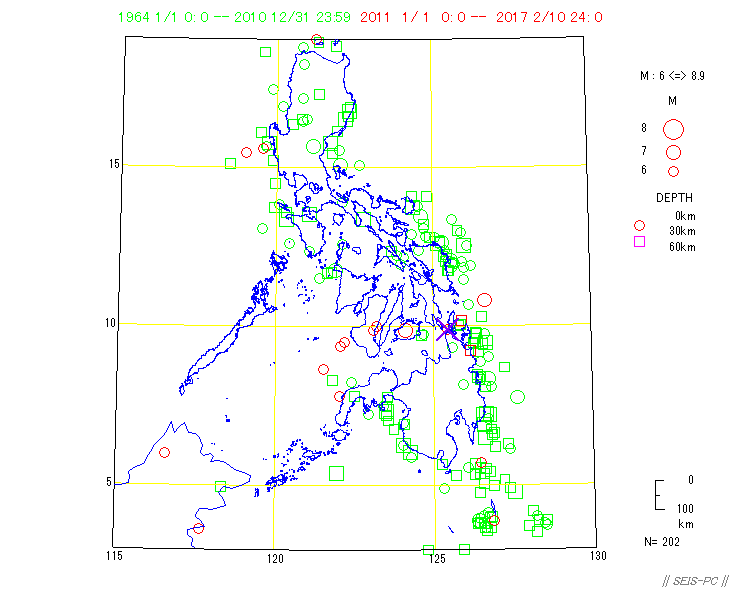 Fig.5 : Data is the same as fig.3. The green symbols showed the events from 1964 to 2010 and red sumbols showed the events after 2011. We can see clear red seismic belt! Return |