|
Kumamoto prefecture M6.5 (2016/APR/14) & M7.3(APR/16)  Fig.A: Hi-net auto determined hypocenters. Dark brown lines shows active faults. The trend of aftershock distribution shows NE-SW diirection. M of the mainshock was 6.1 by Hi-net auto.  Fog.B: The time-space distribution of hypocenters within the frame in the fig.A. The upper is NE side.  Fig.C: M-T figure of hypocenters within the frame in the fig.A. 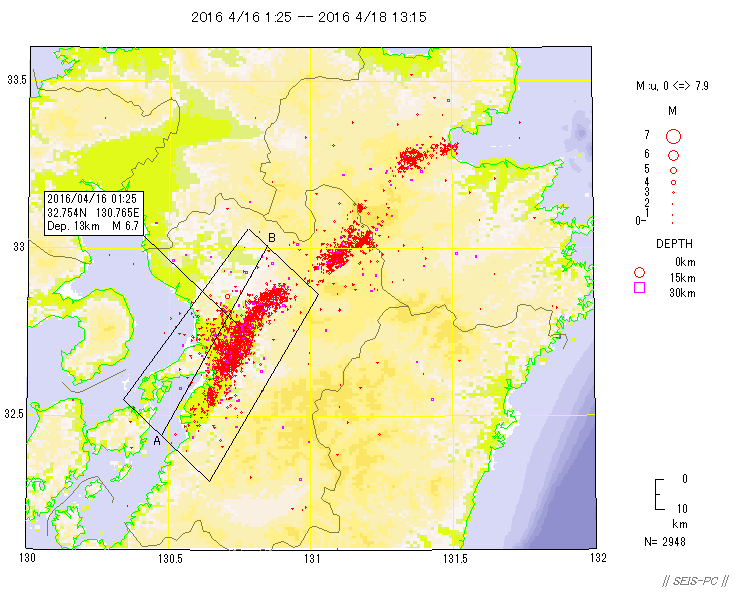 Fig.D: M7.3(M6.7 in this figure) occurred on 16th 01:25 located on the Uto fault. M5.9(USGS M5.7) event occurred at 01:45 located on northeast side. M5.4(USGS M5.3) event occurred at 03:03 located in Aso Caldera. 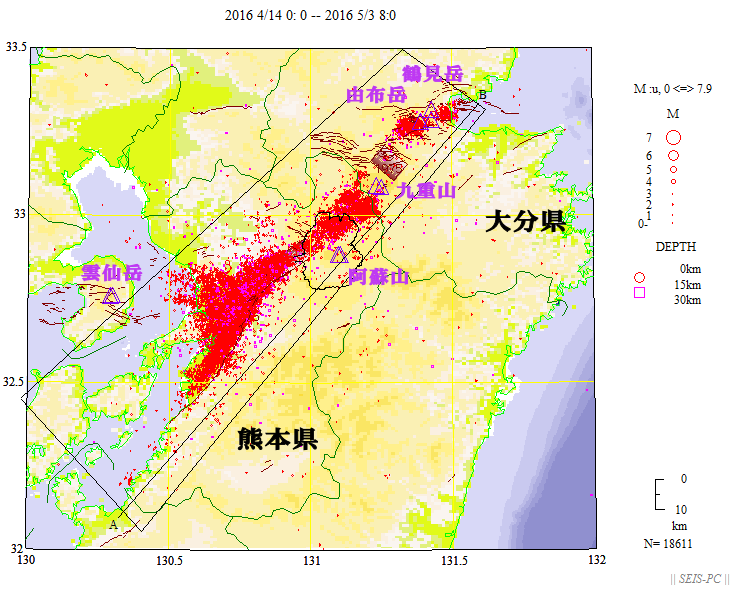 Fig. E: Hypocenter distribution from April 1. Hi-net auto determined hypocenters by NIED. 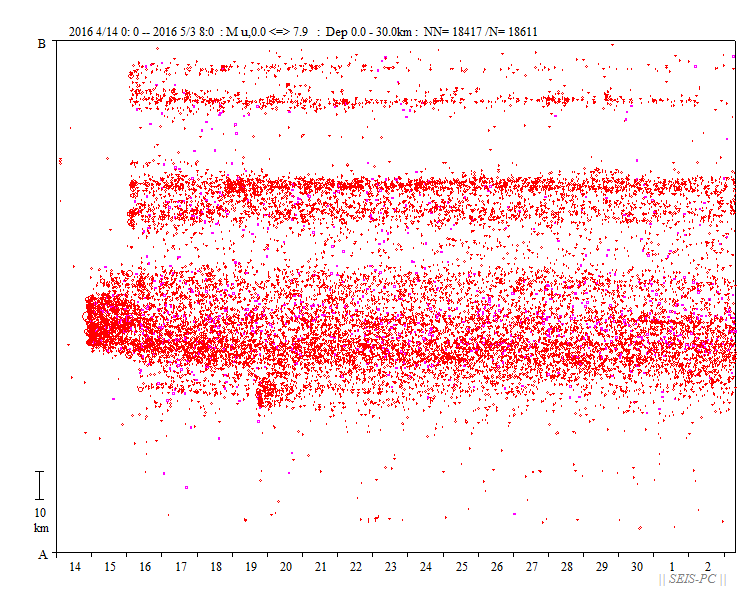 Fig. F : Time-space ditribution within the frame in the fig. E. 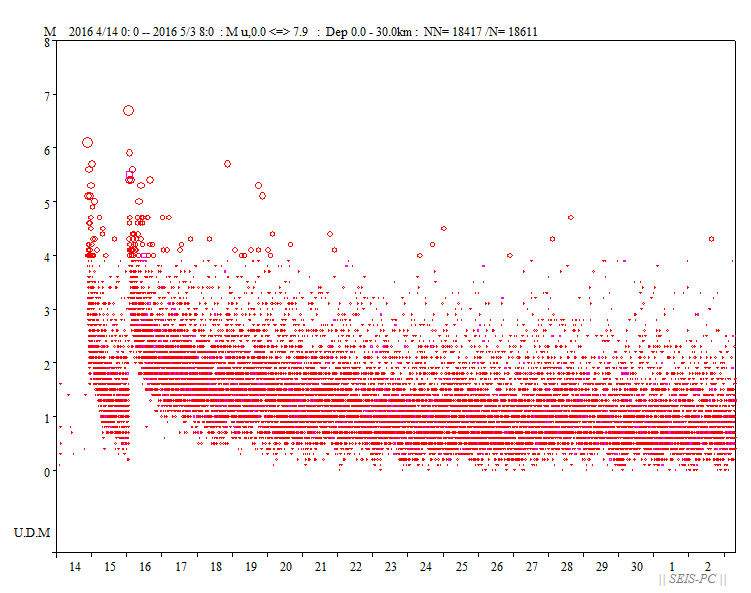 Fig. G : M-time figure within the frame in the fig.E. 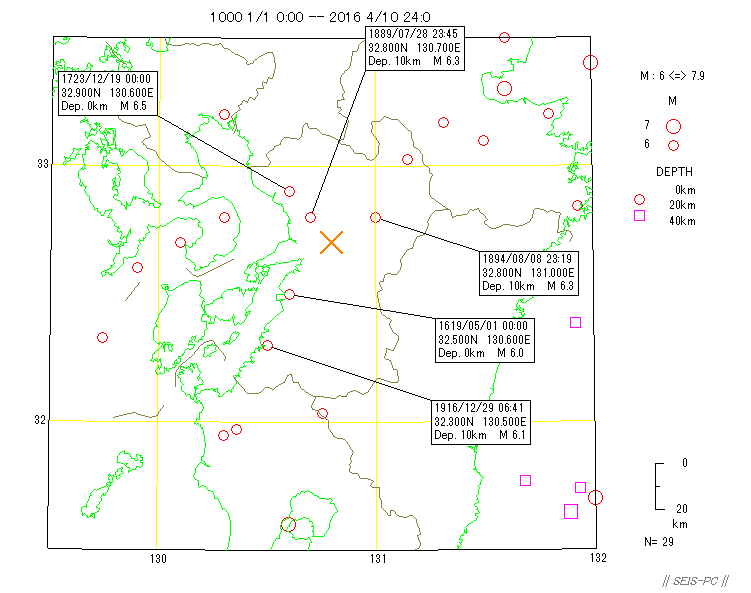 Fig.1: The cross shows the epicenter of JMA urgent hypocenter. 32.7N, 130.8E, depth 10km. M6.5 is estimated by JMA urgently. USGS gave M6.2. Hypocenters were shown from AD1000 to 2016 Apr. 11. Depth=<40km, M>=6. 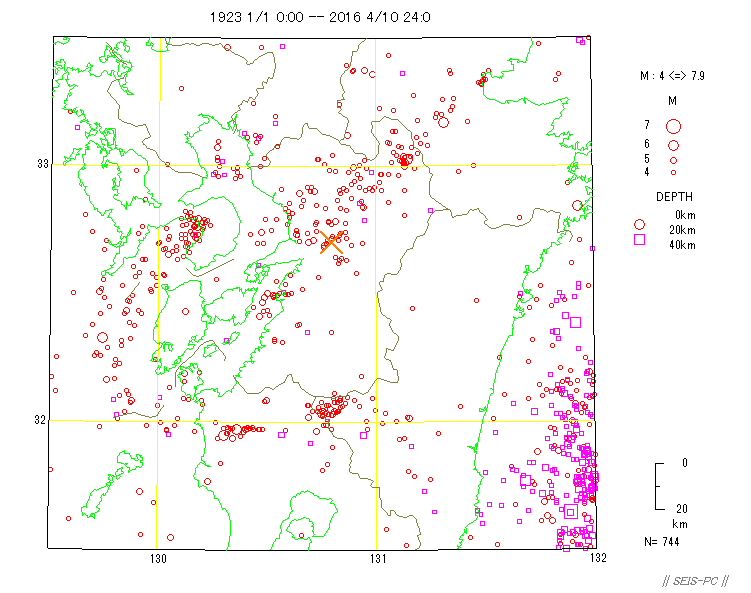 Fig.2: Hypocenters from 1923 to 2016 Apr. 11, M>=4, depth=<40km.  Fig.3: The CMT solution by NIED F-net. Mw6.1. RETURN |