|
Pakistan earthquake (2013/Sep/24) 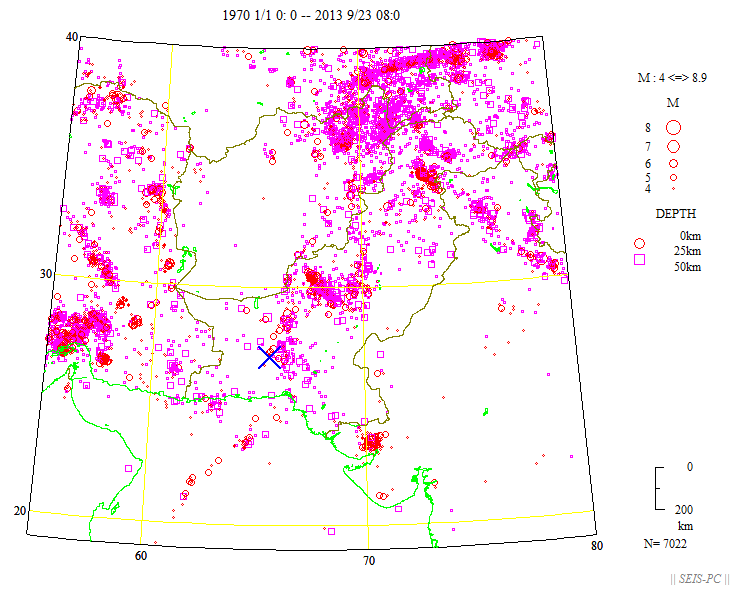 Fig. 1 : Shallow hypocenter distribution from 1970 to 2013 Sep. 23 08:00. ( Depth =< 50km, M>=4 9 ). Time is UT. Data from USGS. The big blue cross shows the epicenter and its magnitude is Mw 7.7 by USGS. 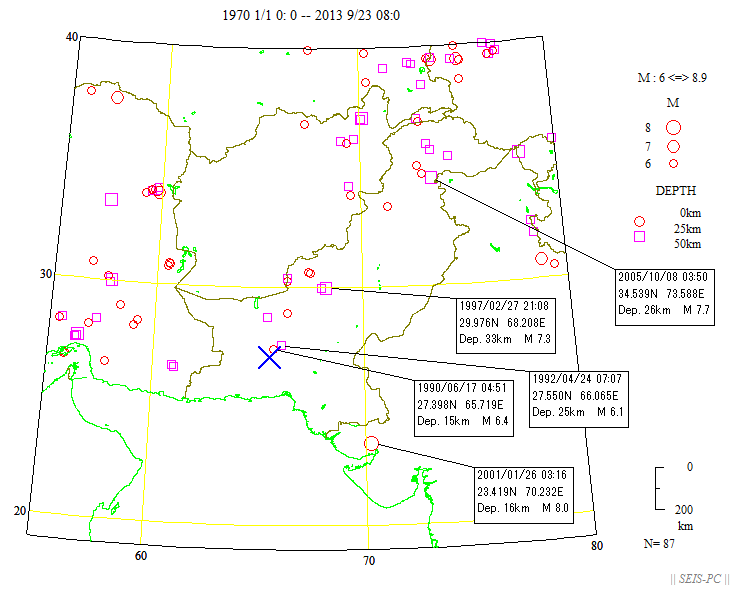 Fig. 2 : Shallow Hypocenter distribution , M>=6.0. M6.4 event in 1990 and M6.1 event occurred near this earthquake. 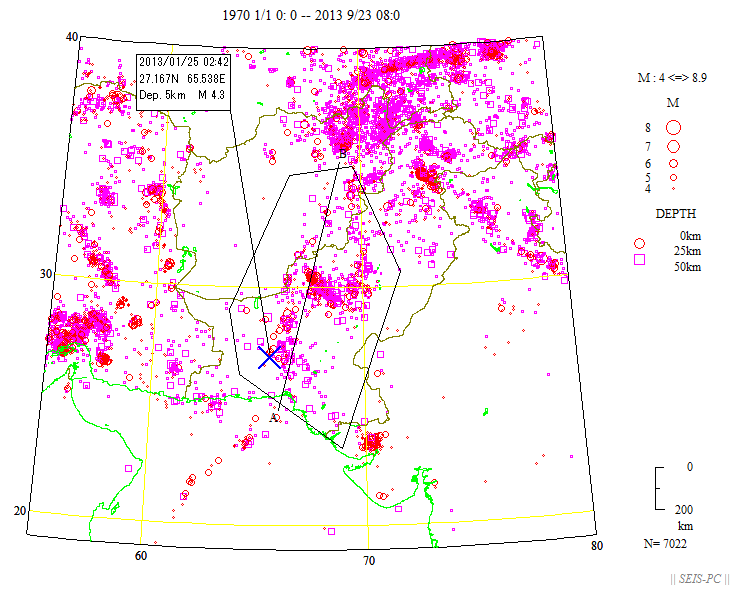 Fig. 3 : Shallow hypocenter distribution from 1970 to 2013 Sep. 23 08:00. The time-space distribution of the events in the hexagon is shown in fig.4. The M4.3 event on Jan. 25 in this year occurred near this earthquake. 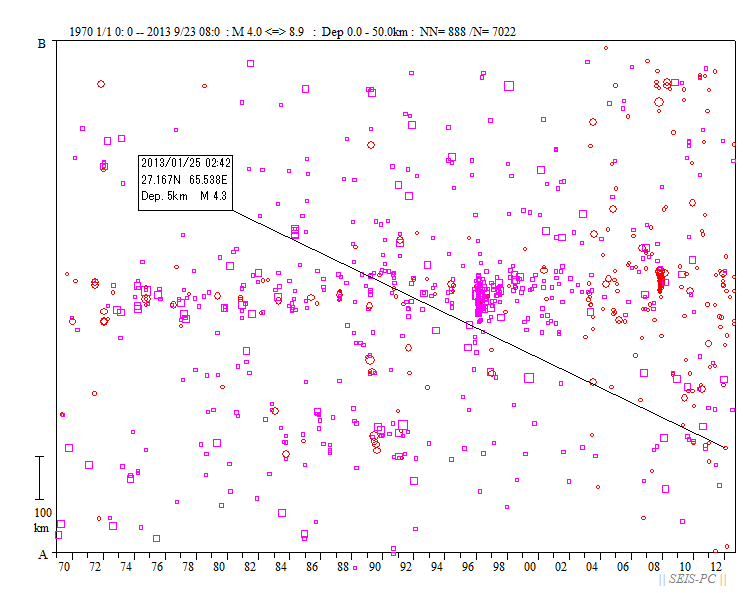 Fig. 4 : The time-space distribution of the events in the hexagon in fig.3. The upper side is north. 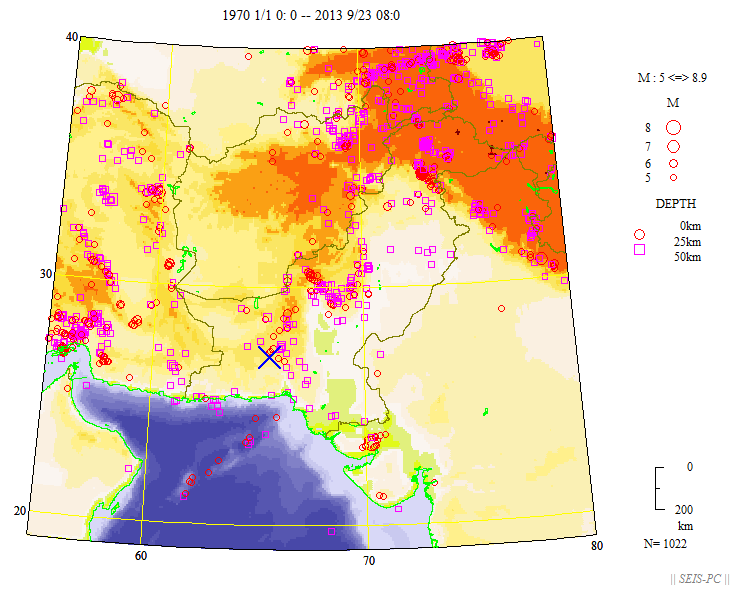 Fig. 5 : Shallow hypocenter distribution , M>=5.0. 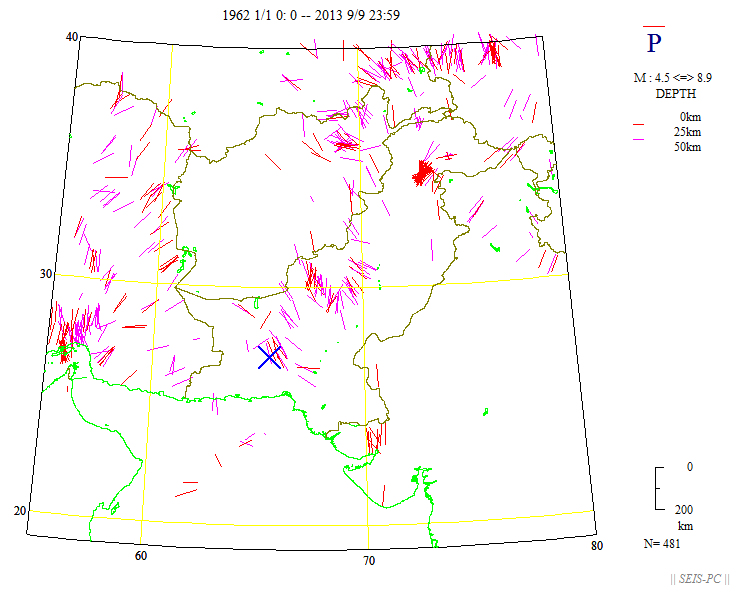 Fig. 6 : P axes distribution of shallow hypocenters obtained by Global CMT group. P axes are projected to the earth surface. 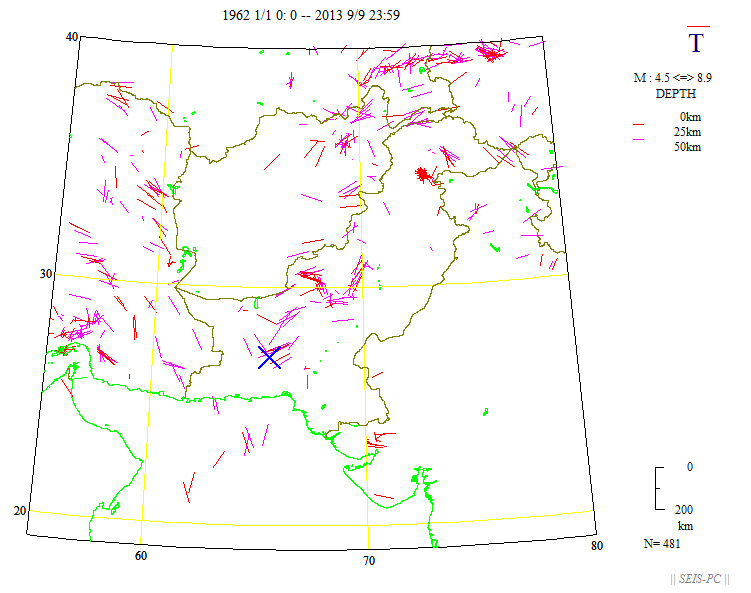 Fig. 7 : T axes distribution of shallow hypocenters obtained by Global CMT group. T axes are projected to the earth surface (1962--2013/Sep/9). 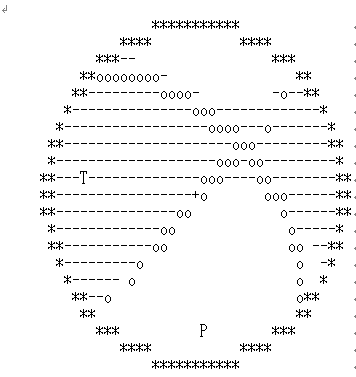 Fig. 8 : Auto CMT solution by USGS. RETURN |