|
Bohol, Philippine earthquake (2013/Oct/15) 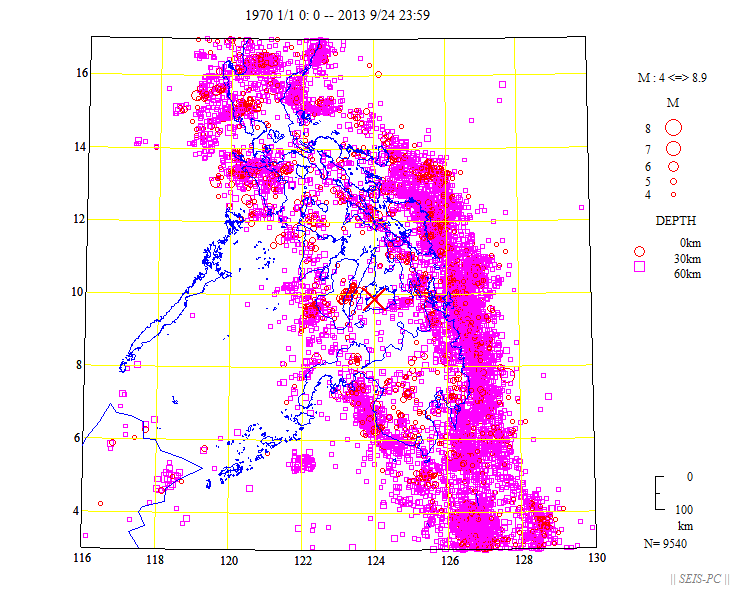 Fig. 1 : Shallow hypocenter distribution from 1970 to 2013 Sep. 24 23:00. ( Depth =< 60km, M>=4.0 ). Time is UT. Data from USGS. The big blue cross shows the epicenter and its magnitude is Mw 7.1 by USGS. 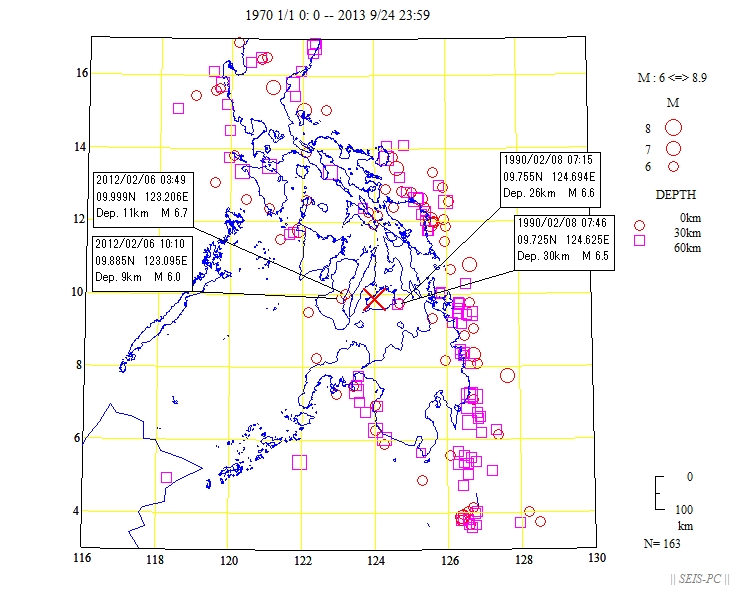 Fig. 2 : Shallow Hypocenter distribution , M>=6.0. The big blue cross shows the epicenter of this event. 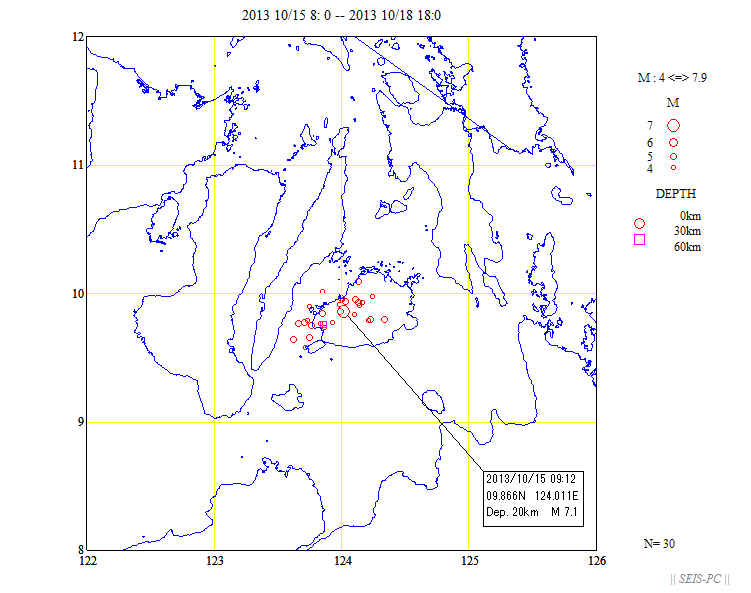 Fig. 3 : The mainshock and after shock distribution from 2013 Oct 15 to Oct 18 (Time is JST: JST=UT+9H) Aftershcoks distributed along the NW coast of the Bohol island. So, the fault plane is supposed to be along this aftershock belt. 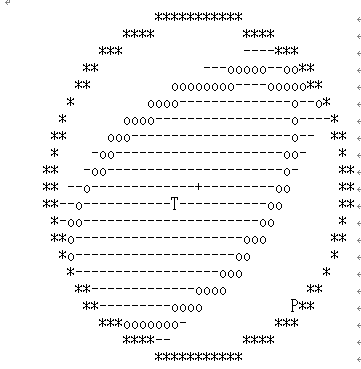 Fig. 4 : Fault plane solution obtained from CMT by USGS. It is the reverse fault. 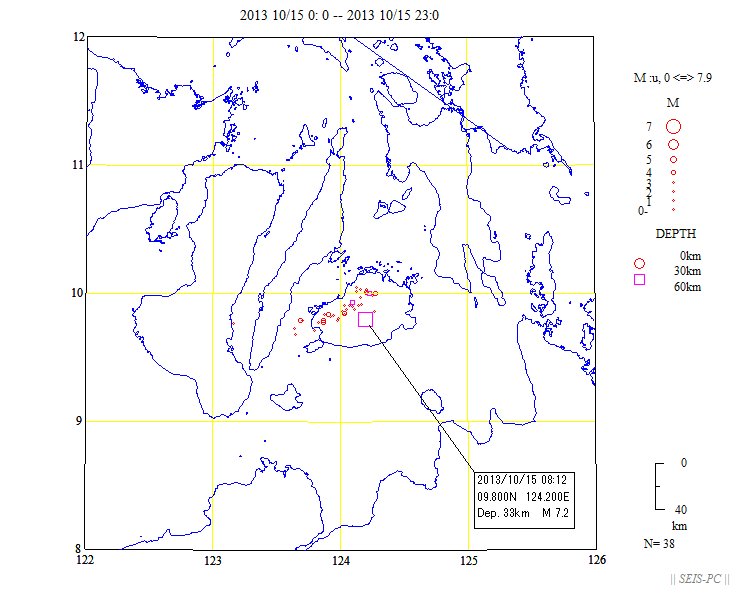 Fig. 5 : The main shcok and after shock distribution. The data are from PHIVOLCS. The location of the mainshcok was not determined well. RETURN |