|
Mjma6.3,Mw5.8 earthquake in Awaji island, Japan (2013/Apr/13) 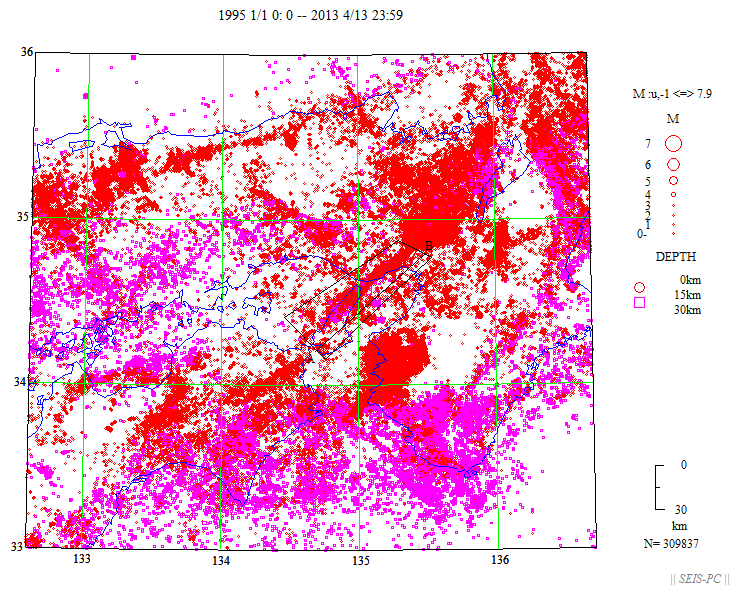 Fig.1 :Epicenter distribution from 1995 Jan.1 to 2013 Apr. 13.(JST) Data from JMA unified catalog, depth =< 30km. 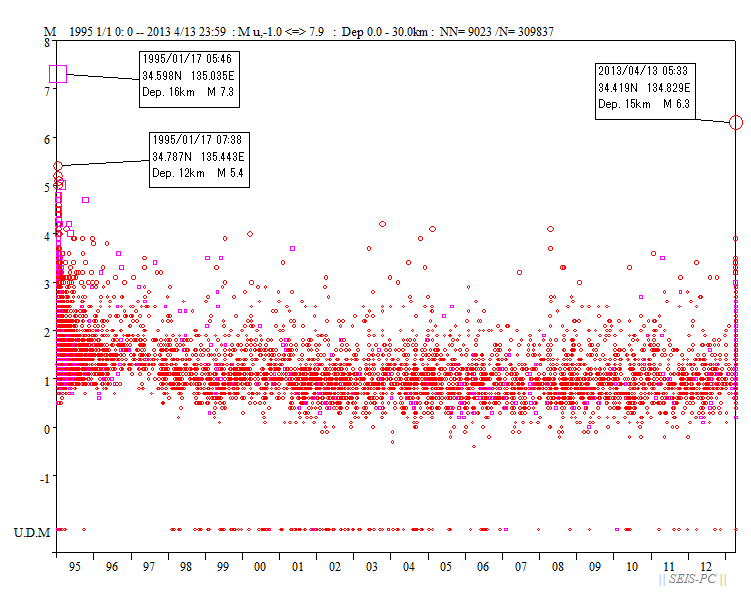 Fig.2 : The magnitude-time figure of events in the area in Fig.1. 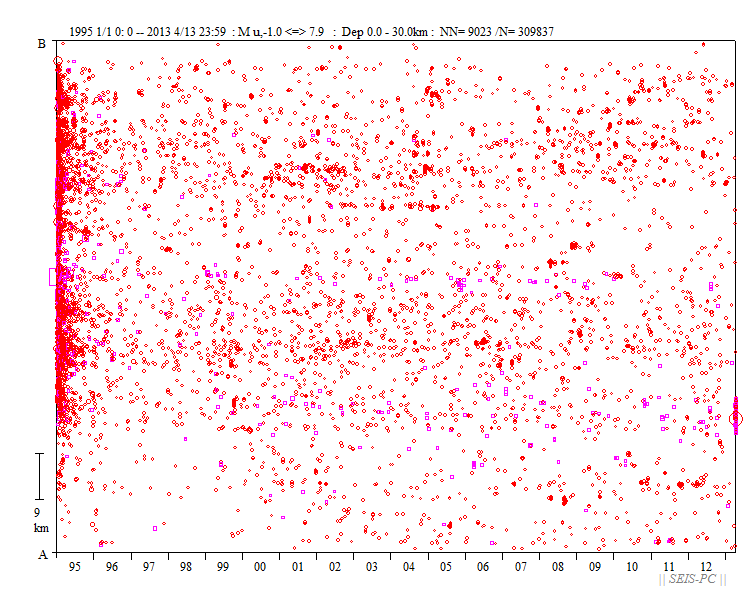 Fig.3 : time-space distribution of events in the area in Fig.1 . The seismicity of the source are was rather low just before the M6.3 event. 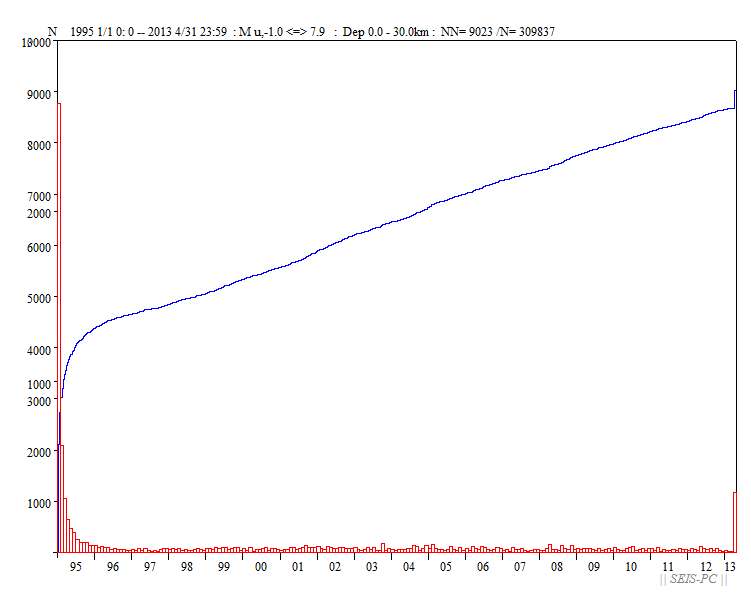 Fig.4 : events number - time figure. The red line shows monthly number and blue line shows the cummulative number. The date of the top was wrong. April 31 should be April 13, sorry! 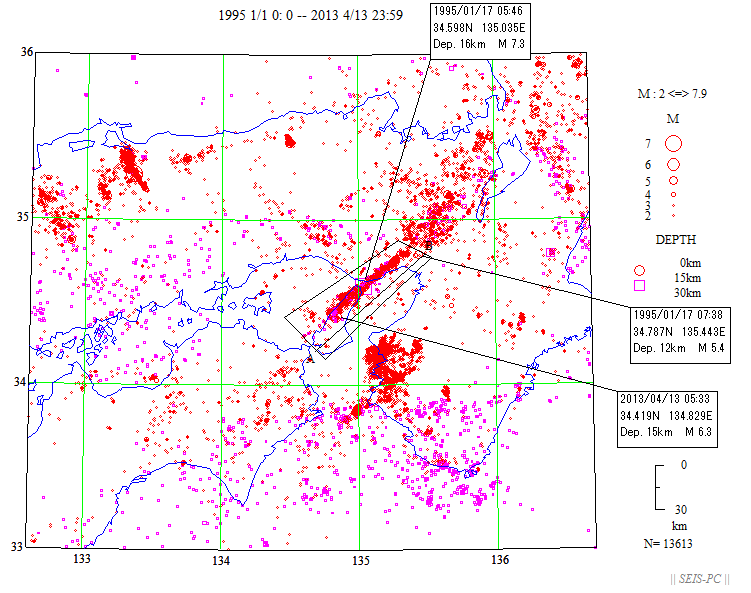 Fig.5 : Epicenter distribution M>2.0. 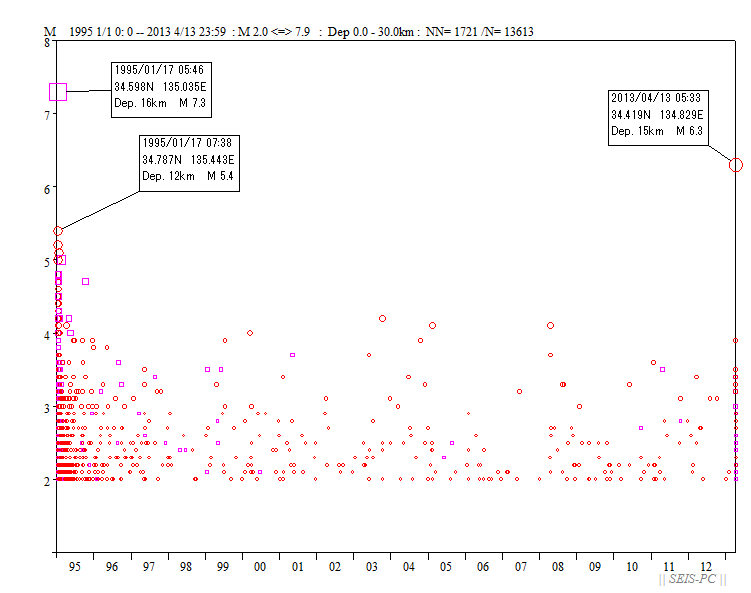 Fig.6 : Magnitude-time figure of events in the area of Fig.5. 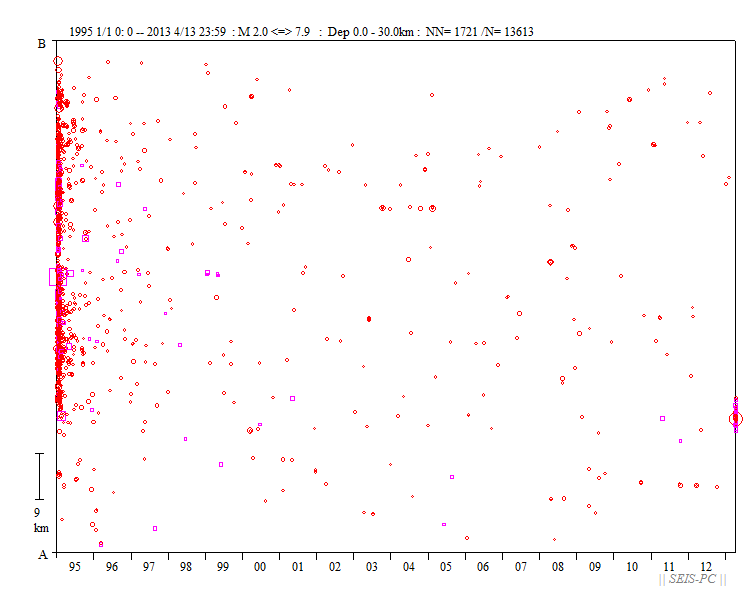 Fig.7 : Time- space figure of events in the area of Fig.5. 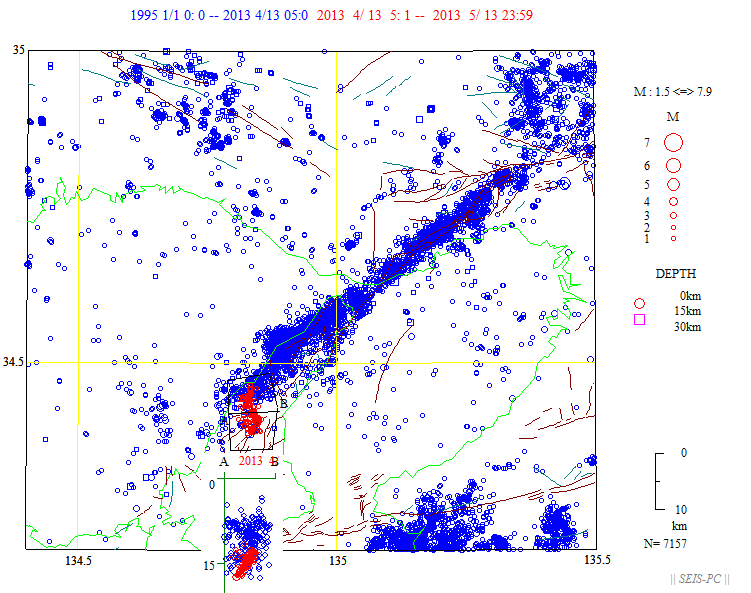 Fig.8 : Epicenter distribution M1.5 by JMA data. Blue sysmbols are from 1995 to 2013 Apr. 13th 05:00 and red ones fromApr. 13th 05:01. Fault plane was west dipping thrust. 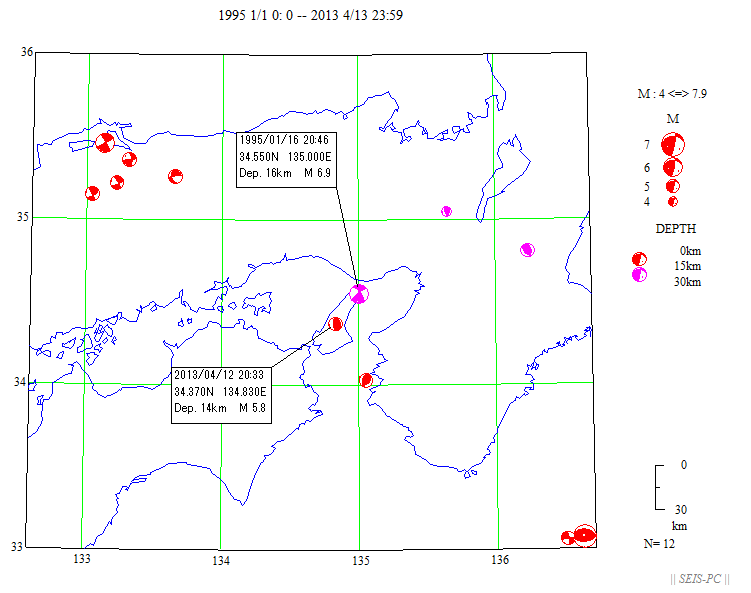 Fig.9 : CMT solutions by Groubal CMT group. 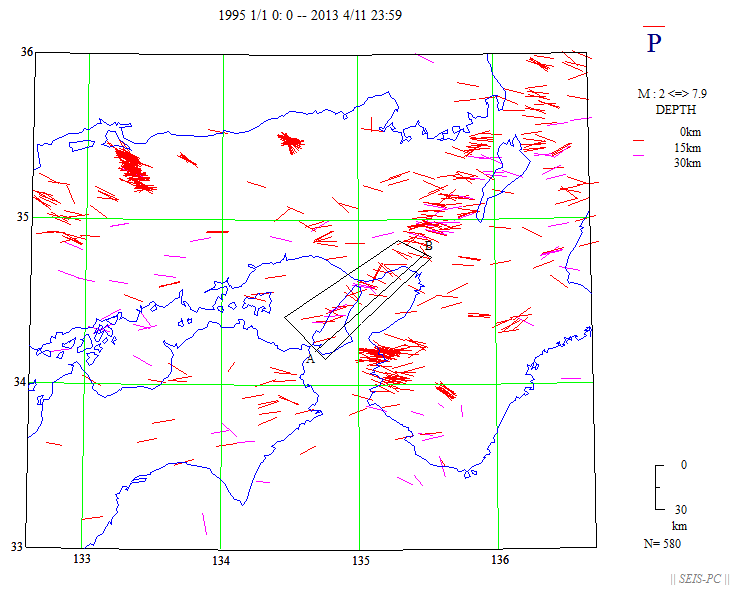 Fig.10 :Fault plane solutions determined by P wave first motion directions by JMA. This time event was not included. 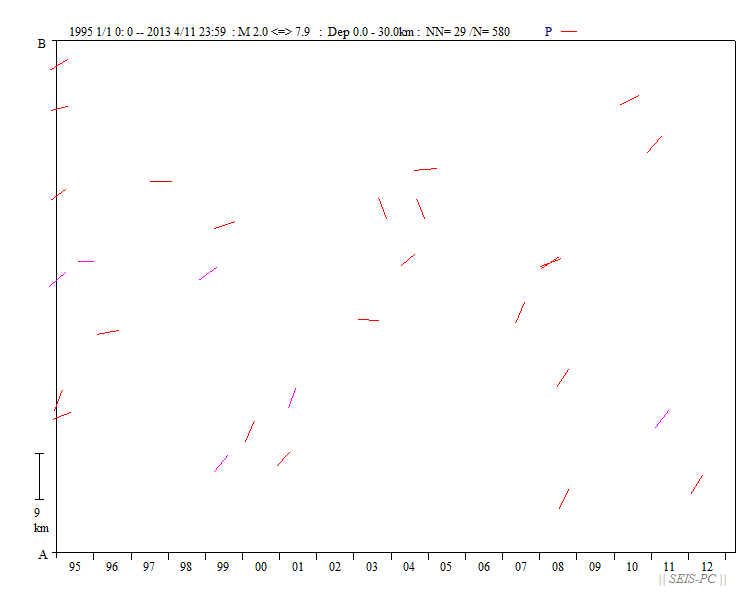 Fig.11 : Time-space change of P direction of events in the area of Fig.10. 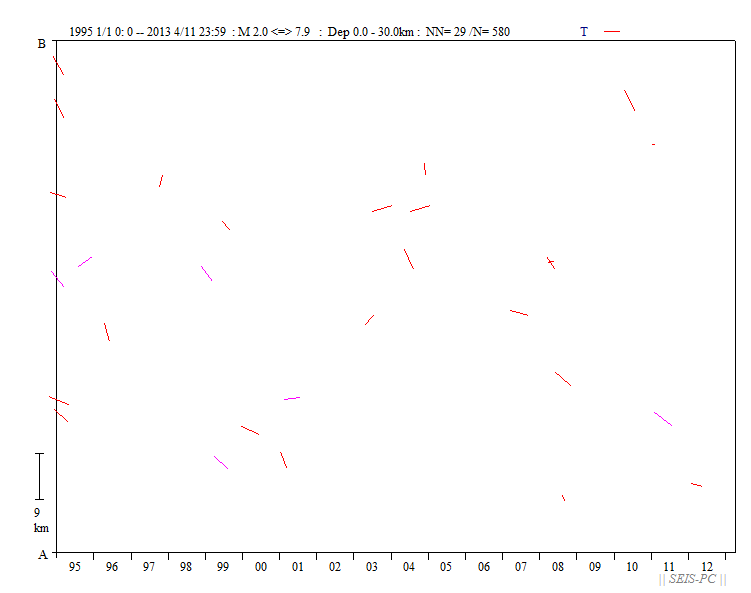 Fig.12 : Time-space change of T direction of events in the area of Fig.10. 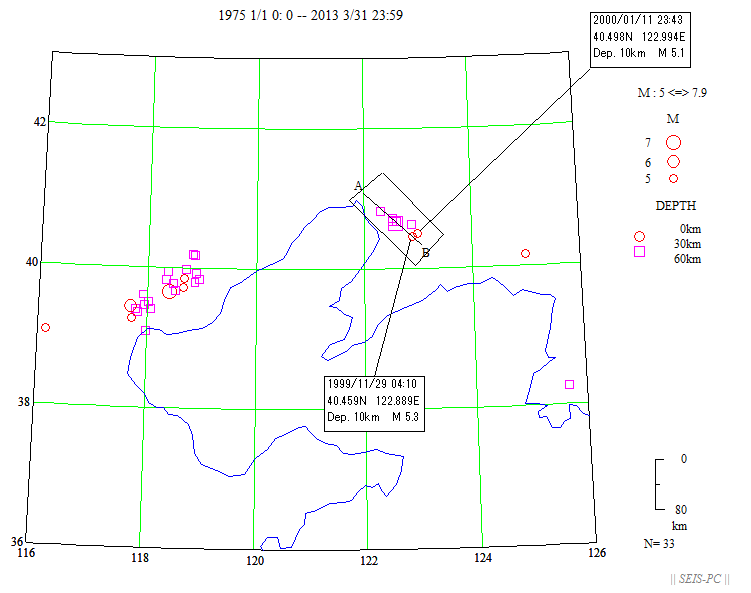 Fig.13 : M>=5 mainshock and aftetshock distribution of 1975 Haicheng earthquake in China. Data from PDE. This is a sample of late big aftershock. 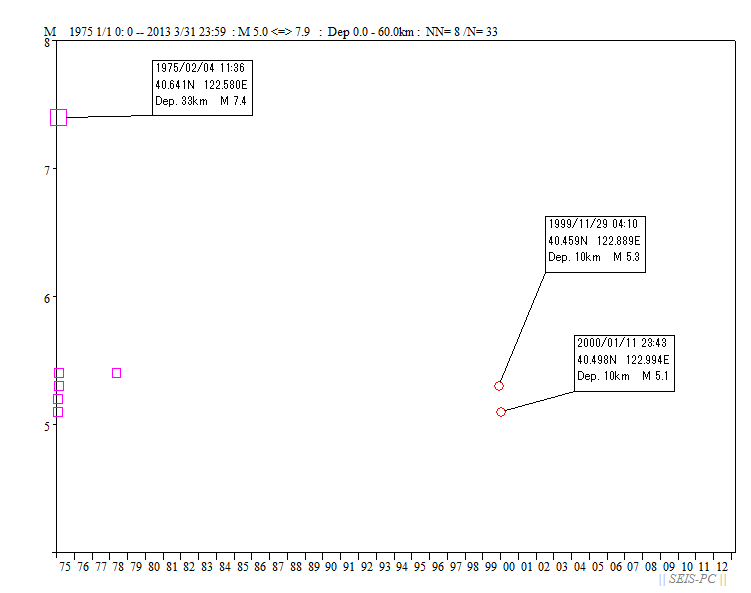 Fig.14 : About 24 years after the mainshock M5.3 event occurred. 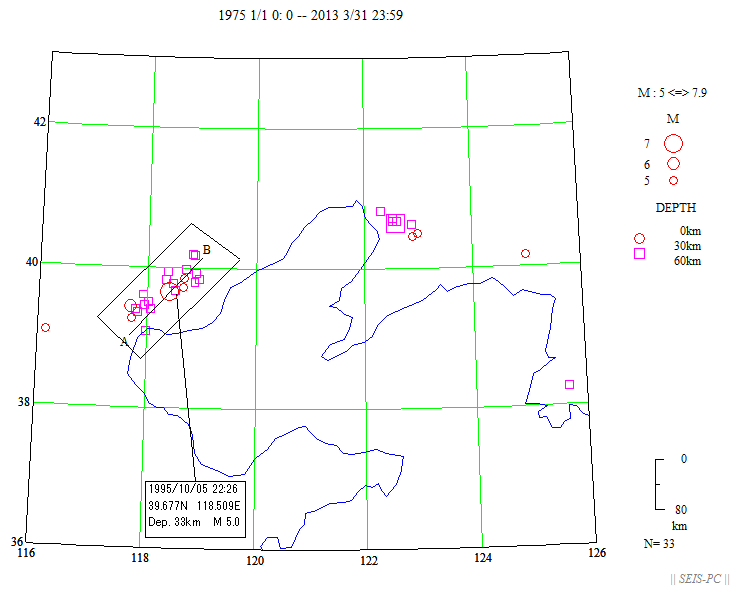 Fig.15 : M>=5 mainshock and aftetshock distribution of 1976 Tanshan earthquake. 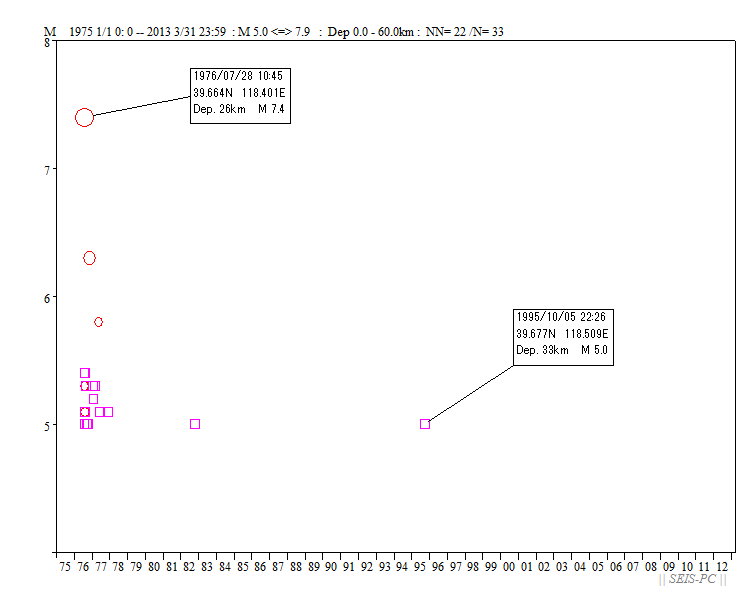 Fig.16 : About 19 years after the mainshock M5.0 event occurred. RETURN |