|
SW off Sumatra M8.6(2012/4/11) 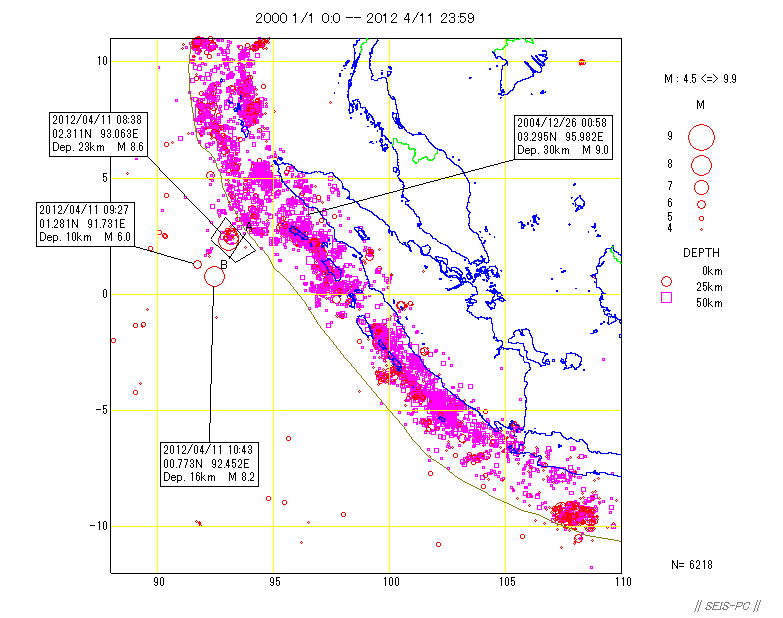 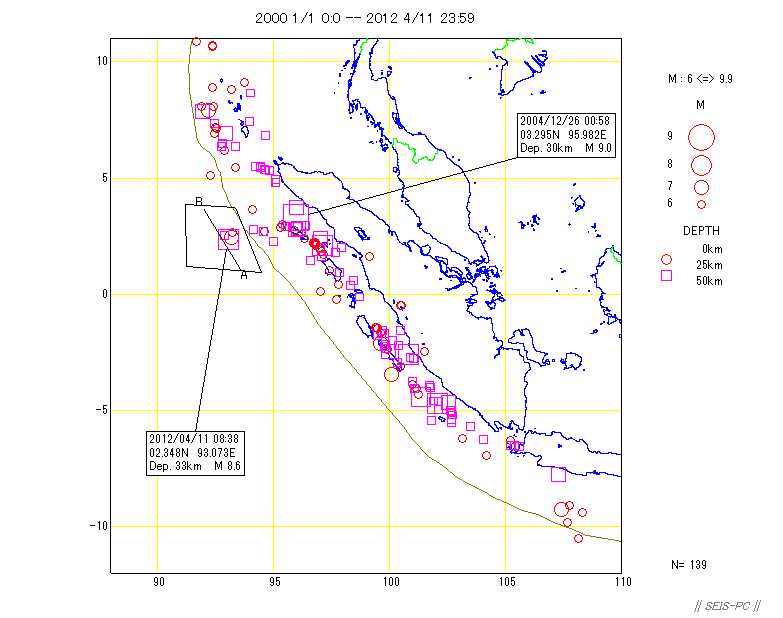 Fig. 1 : UTC was used and data from USGS. The black lines show the plate boundaries. M>=4.5 and 6 events were shown in and around Sumatra after 2000. This event occurred outside of the trench, so it seemed to be the outer-rise event. Two hours later, M8.2 event occurred some far from the trench. 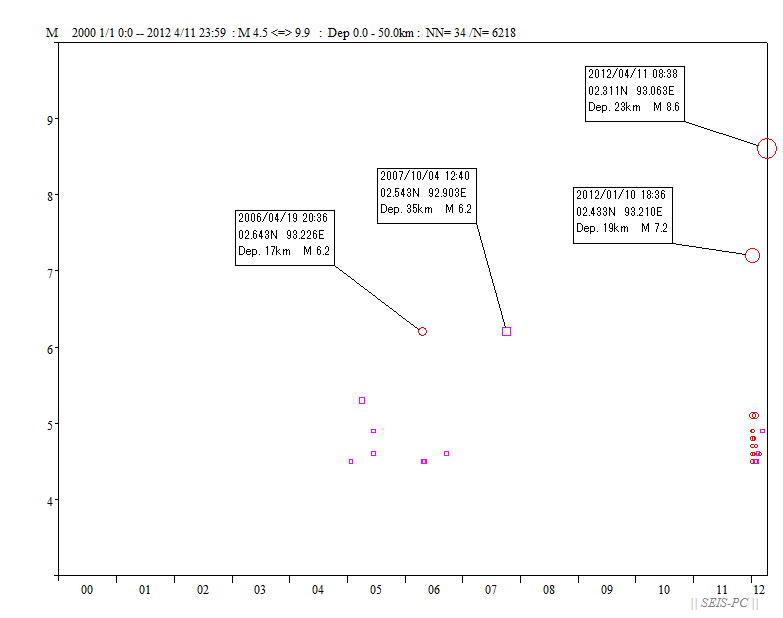 Fig. 2 : Magnitude-time figure of the events in the tetragon in the upper map. M 7.2 event was occurred near the this event in this Jan.. 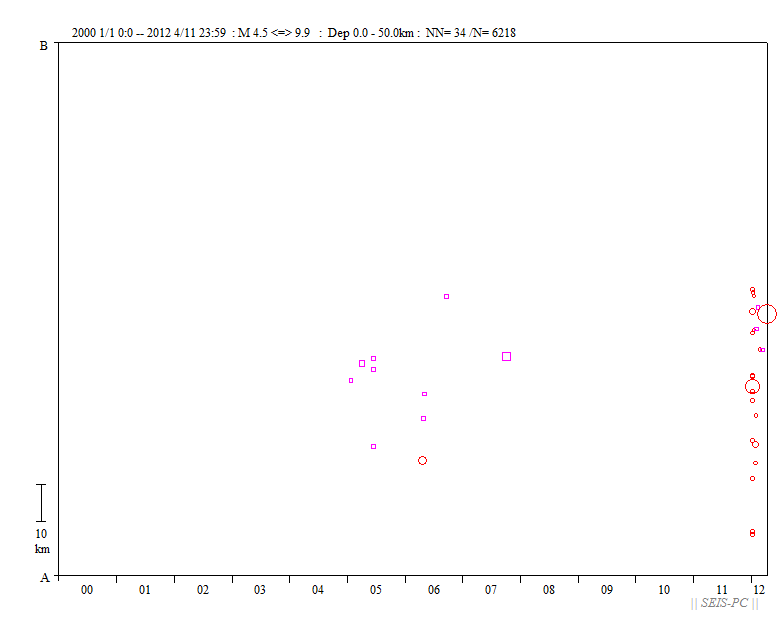 Fig. 3 : The time-space distribution along AB line in the tetragon. 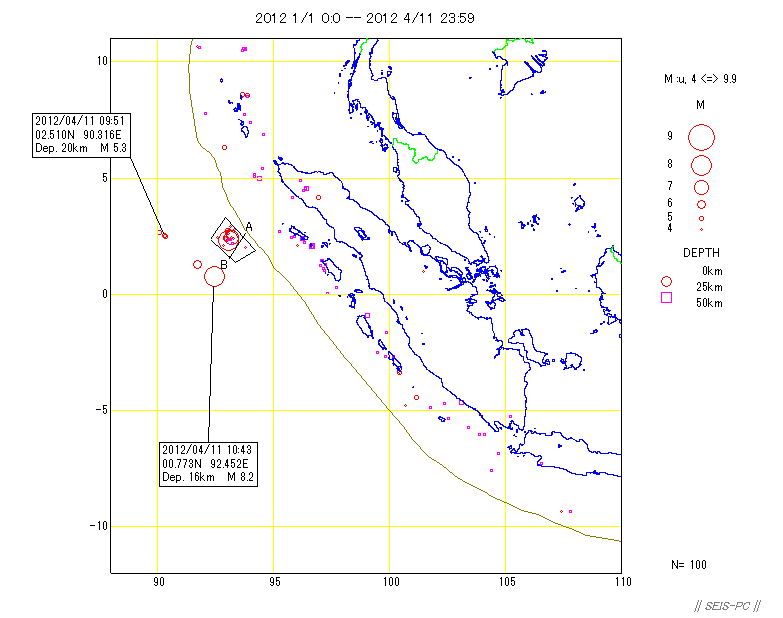 Fig. 4 : The epicenter distribution in this year including smaller events. 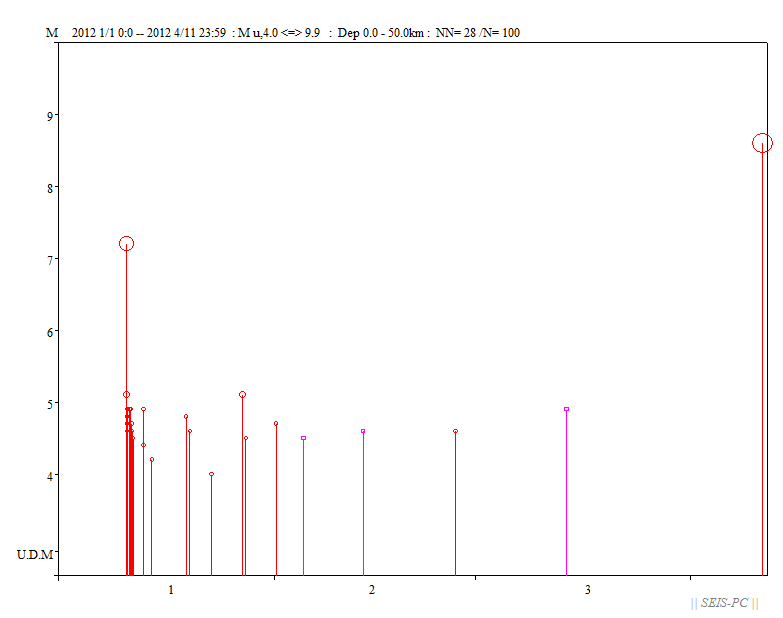 Fig. 5 : Magnitude-time figure of the events in the tetragon in the fig. 4. 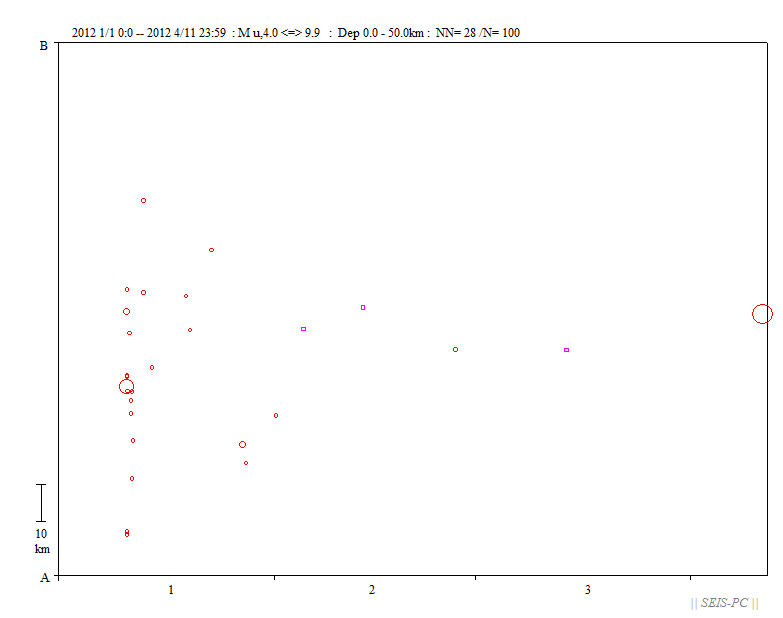 Fig. 6 : Time- space ditribution of the same area. 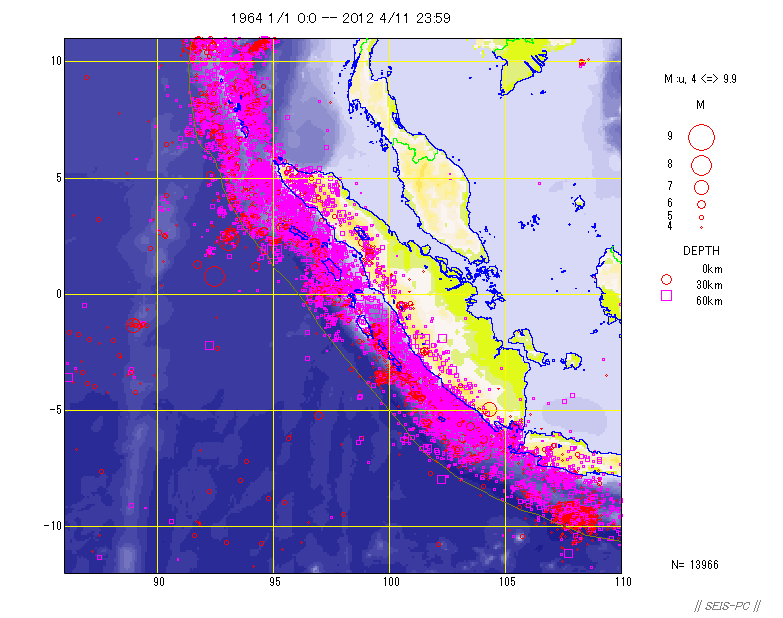 Fig. 7 : The epicenter distribution from 1964. The linearment of epicenter near M8.6 epicenter is perpendicular to the trench axis. 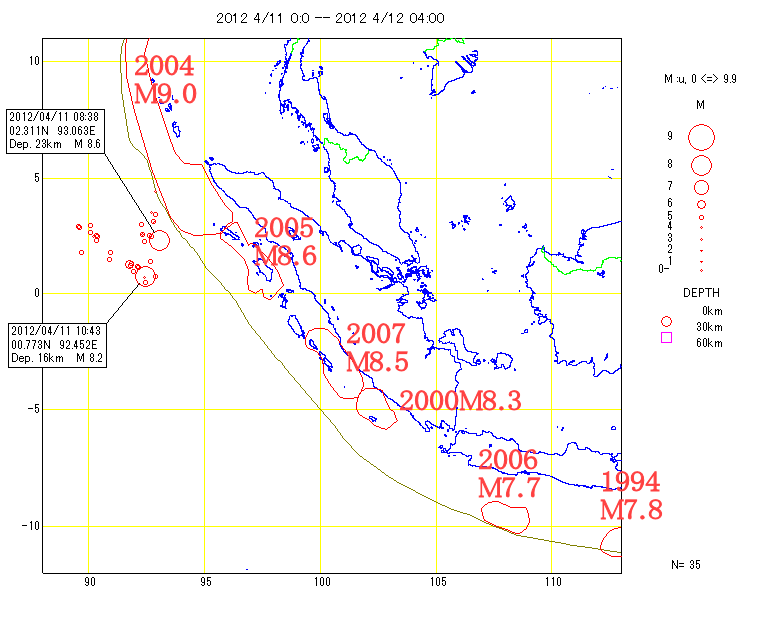 Fig. 8 : Epicenter distribution after this event and source areas of past major events. 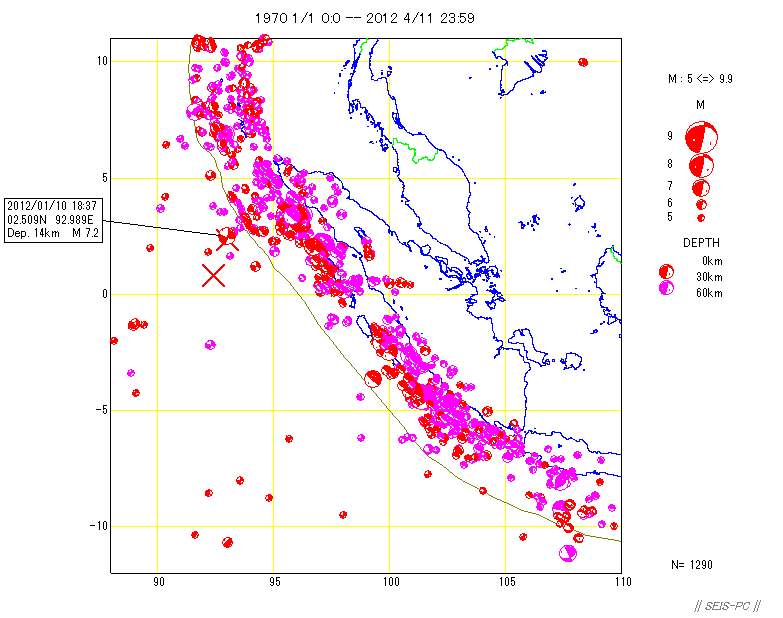 Fig. 9 : Beach balls distribution from GCMT solutions. Strike slip solutions are predominant around the epicenter. Tese two events were not included. 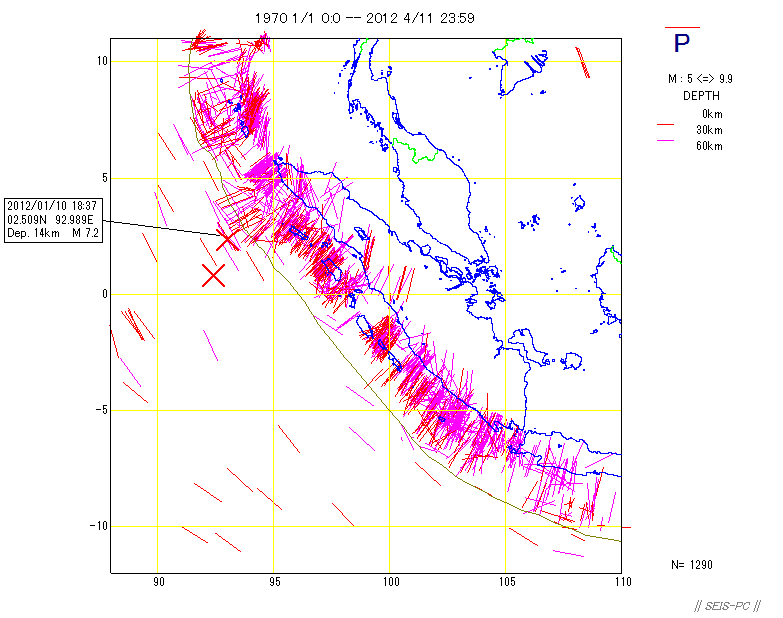 Fig. 10 : P-axes distribution obtained by GCMT projected to the earth surface. The directions of P-axes are mostly parallel to the trench axis. These two events were not included. The cross shows the epiceter. 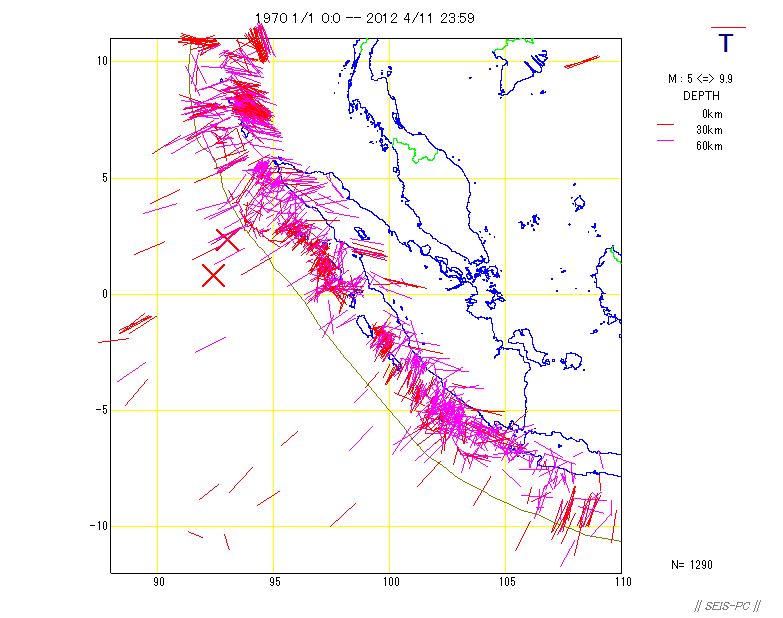 Fig. 11 : T-axes distribution obtained by GCMT projected to the earth surface. The direction of T-axes are mostly perpendicular to the trench axis. Retrun |