|
Philippine island region M7.6 (Aug. 31, 2012) 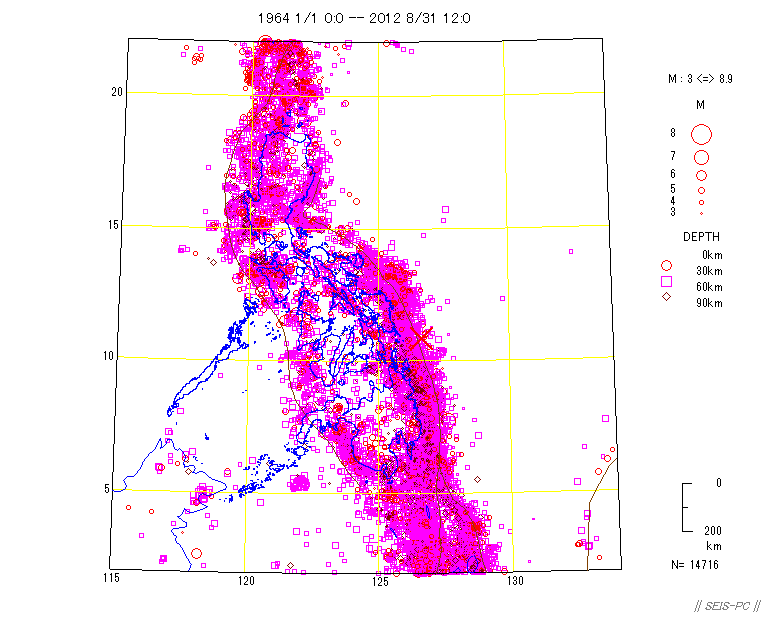 Fig.1: Data from USGS and UTC was used. Epicenter distribution from 1964 to this event (12:47). The red cross shows the epicenter. The brown lines show the plate boundaries. 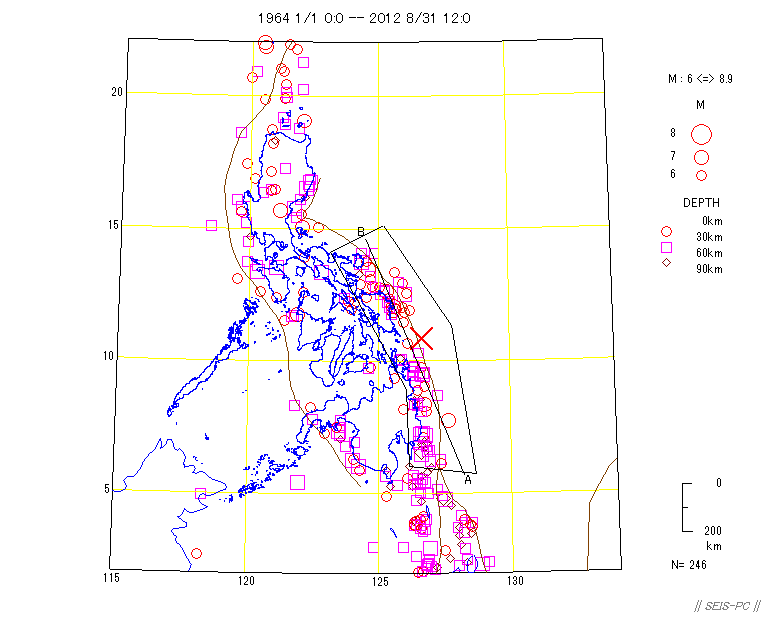 Fig.2 ; Epicenter distribution of M>=6. 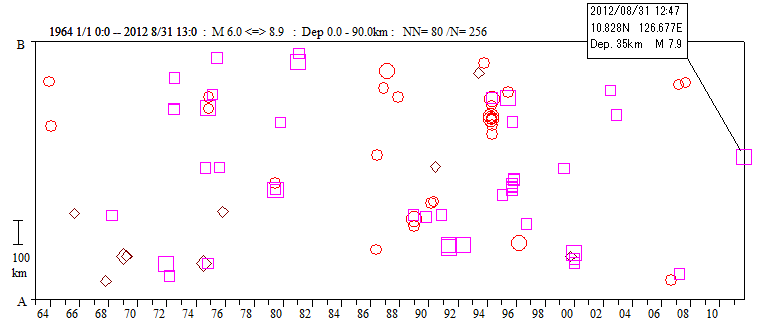 Fig.3 : Tiem-space distribution of events occurred in the area in fig.2. This figure shows the source region was a seismic gap. 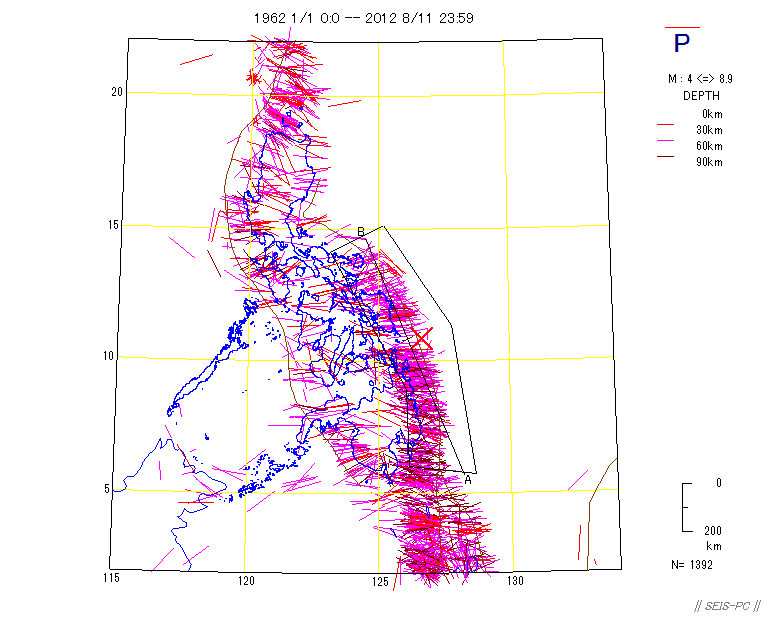 Fig. 4 : P-axes distribution obtained by GCMT projected to the earth surface. 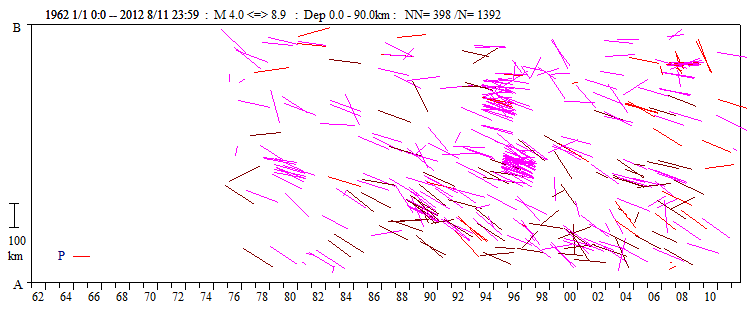 Fig. 5 :Time-space figure of P axes in the area in fig.4. 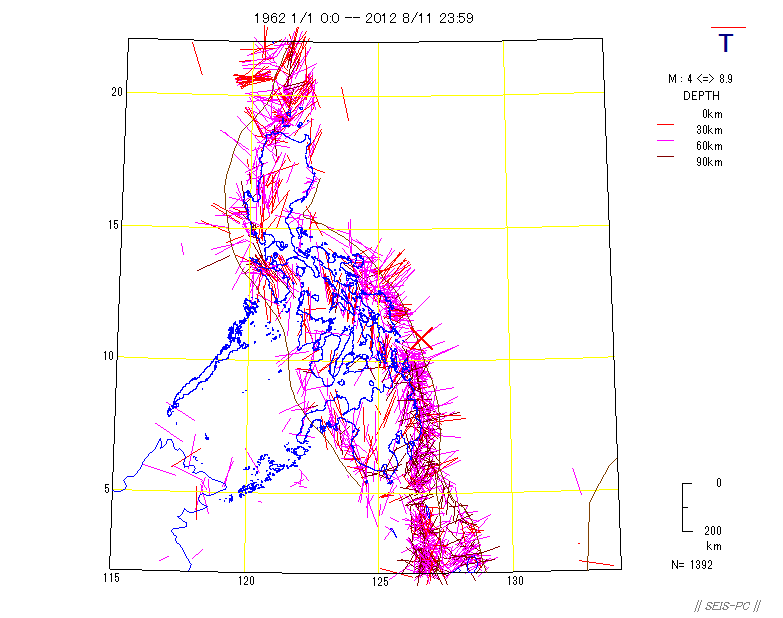 Fig. 6 : T-axes distribution obtained by GCMT projected to the earth surface. Return |