|
Northwestern Iran M6.4 (2012/8/11) 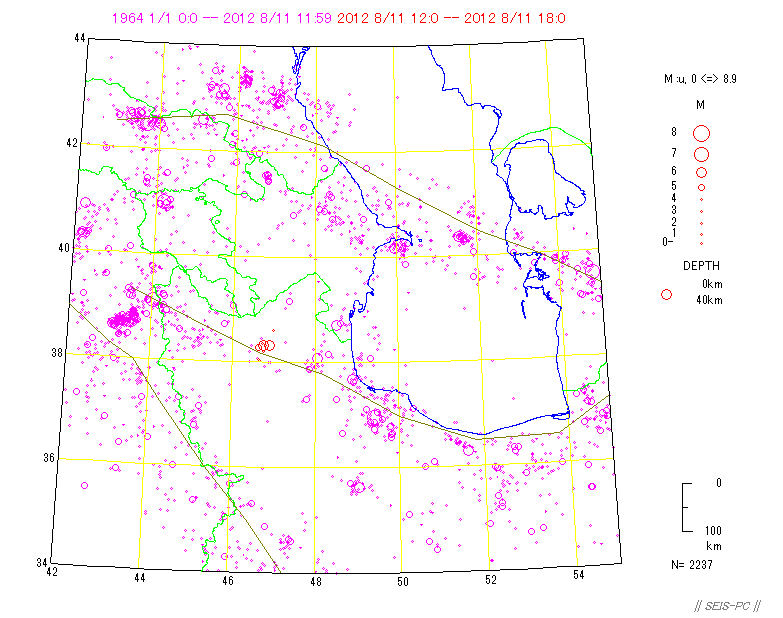 Fig.1 : The epicenter distribution around this event from 1964. UTC was adopted. Red symbols show the events after the M6.4 mainshock occurred at 12:23 and Pink symbols show the events before the mainshock. These earthquakes occurred at the boundary between Eurasian plate and Iranian micro plate. Iranian plate moved west ward to the Eurasian plate. The data shown here is from USGS. The grobal CMT group obtained Mw6.5 and Mw6.3 for major two events. The green lines and brown lines show nation borders and plate boundaries, respectively. The nation border of Iraq and Turkey wes not drawn. 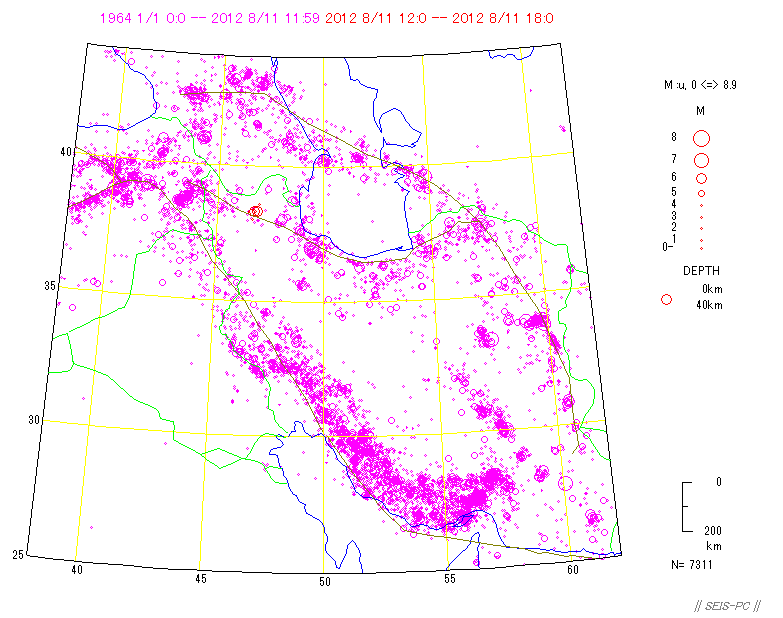 Fig. 2 : the epicenter distribution of wide area. 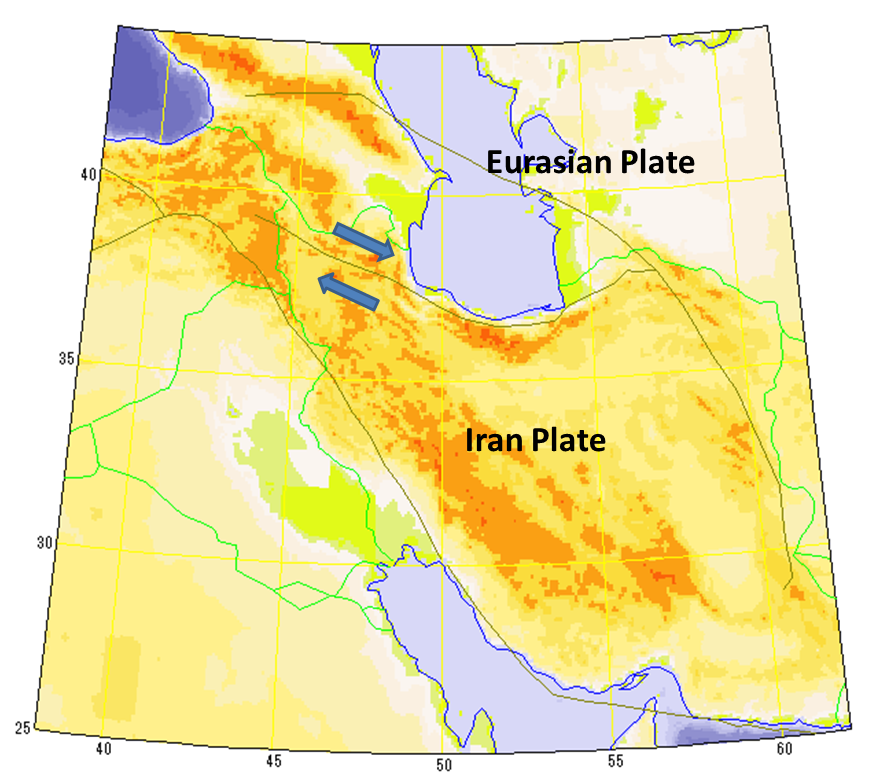 Fig.3 : The relative plate motion. 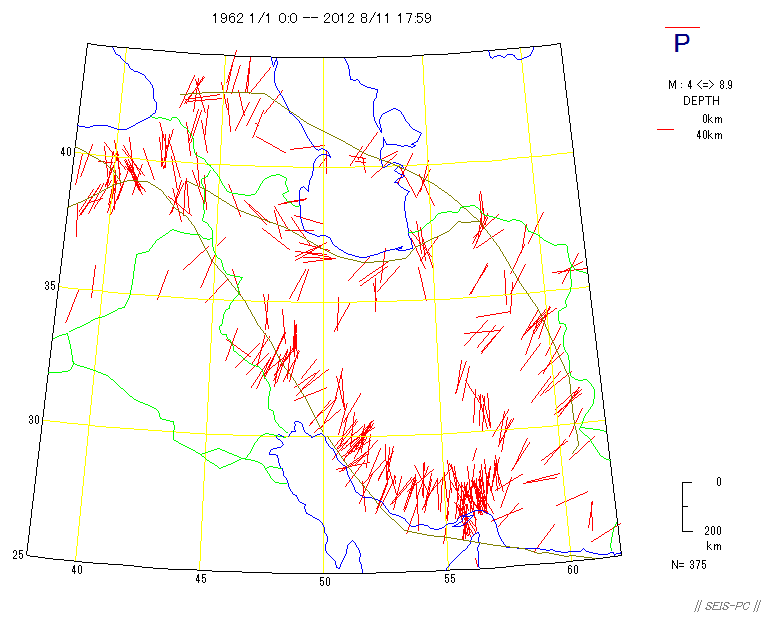 Fig. 4 : P-axes distribution obtained by GCMT projected to the earth surface. 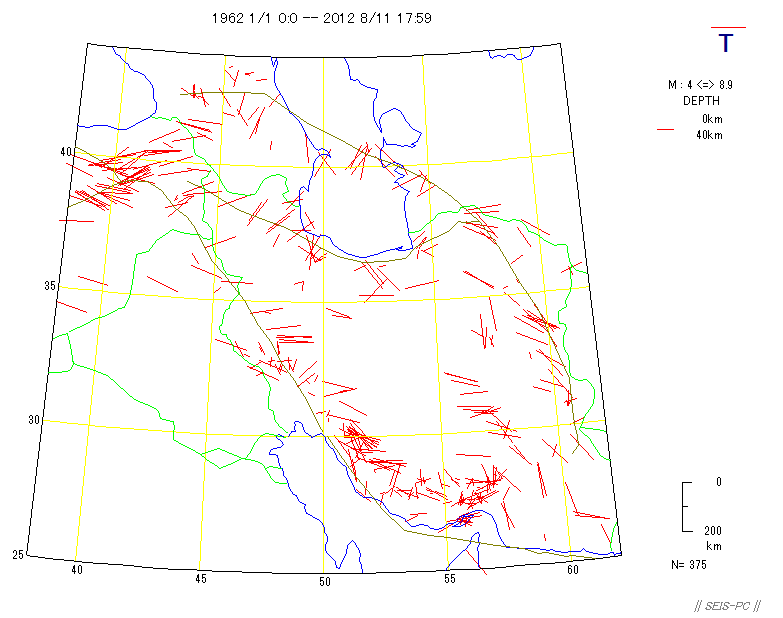 Fig. 5 : T-axes distribution obtained by GCMT projected to the earth surface. 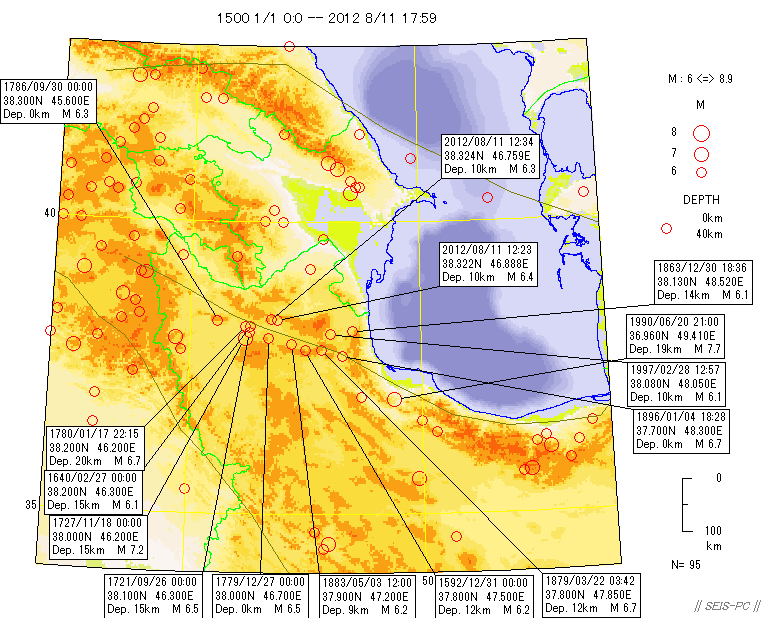 Fig. 6 : The distribution of past disater earthquakes(M>=6) from Utsu catalog and these event. 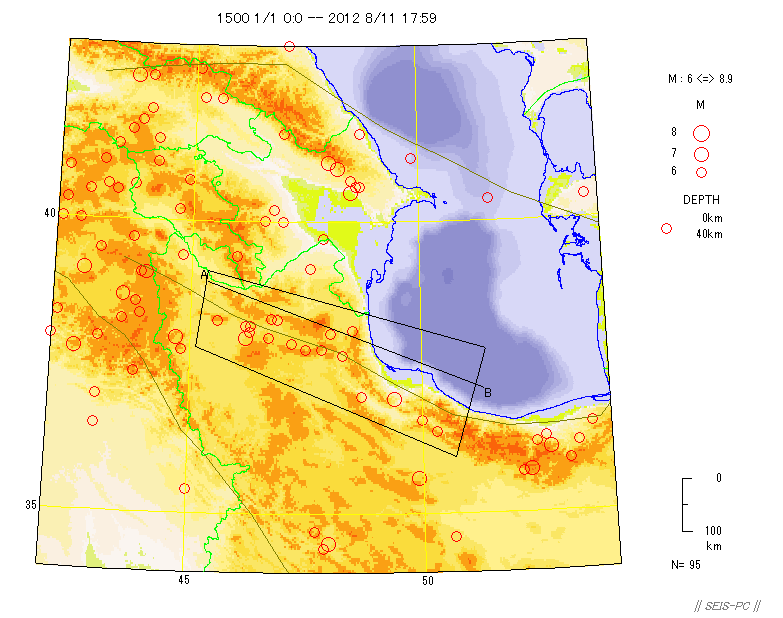 Fig. 7 : Same as fig.7. 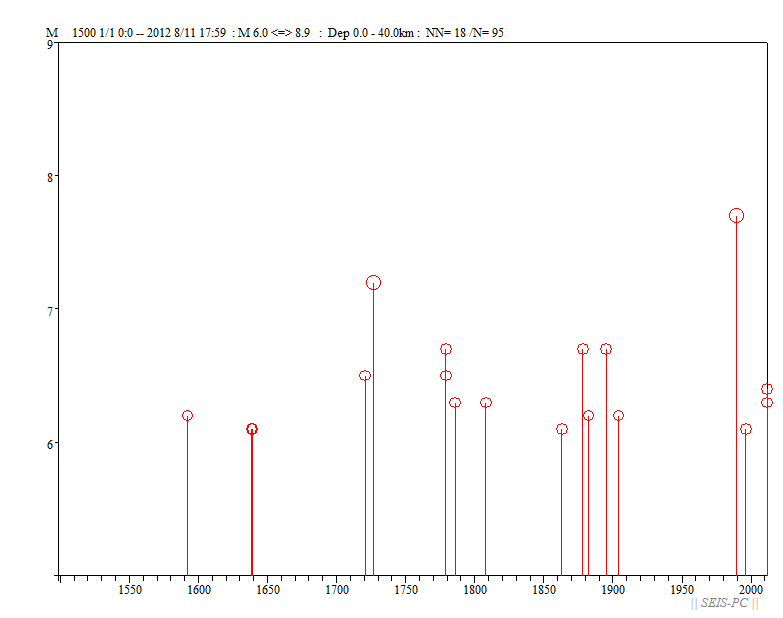 Fig. 8 : Magnitude- time figure of events in the cutout region in fig.7. Iranian Earthquake Engineering Association Top page |